comment enlever les ligne ?
c’est quels dimention a utiliser ?
j’utilise du 500px en largeur. Mais ton image est un peu grande en hauteur. il en faudrait une moins haute, plus en bandeau.
exemple:

avec card_mod, ajoute dans la partie ha-card
border: none;
Bonjour,
Voici pour ma carte dédiée à l’onduleur PowerWalker 600VI SW:
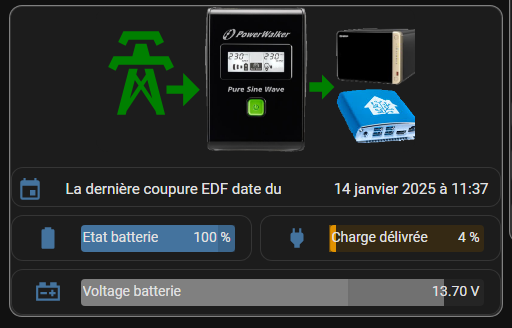
Sur la carte, le pylone passe en rouge clignotant dès qu’une panne de courant est détectée.
Si besoin, je peux refiler les différentes images qui sont sur la carte.
Il faut penser à déclarer ceci dans la config HA :
# dernière date de perte de la tension secteur sur l'onduleur NAS
      onduleur_nas_lastaclost:
        value_template: 'unavailable'
        icon_template: mdi:calendar
        device_class: timestamp
Puis l’automatisation ci-dessous pour la maj de la date (j’ai 2 onduleurs, à adapter donc …).
Il faut le script set_state.py pour la maj du sensor.
Et aussi installer l’intégration save_state qui se charge de sauvegarder l’état du sensor, et sachant que j’ai 2 autres automatisations qui rechargent les sensor dès que HA reboot ou si l’on recharge les sensor qui sont en mode template.
- id: onduleur_demarre
## sauvegarde de l'état des 2 sensors qui mémorisent la dernière panne de courant détectée par les 2 onduleurs
## et envoi d'une alerte pour signaler une coupure possible du courant sur l'appart ou le studio
  alias: onduleur_demarre
  description: ''
  triggers:
  - trigger: state
    entity_id:
      - sensor.onduleur_pc_box_sfr_etat
      - sensor.onduleur_nas_status
    from: 'Online'
    to: 'On Battery'
  conditions: []
  actions:
# si c'est l'onduleur PC/BOX qui vient de déclencher
  - if:
    - condition: template
      value_template:  "{{ (trigger.entity_id == 'sensor.onduleur_pc_box_sfr_etat') }}"
    then:
      - action: python_script.exec
        data_template:
          file: python_scripts/set_state.py
          cache: true
          entity_id: sensor.onduleur_pc_box_sfr_lastaclost
          state: '{{ now() }}'
      - action: saver.save_state
        data:
          entity_id: sensor.onduleur_pc_box_sfr_lastaclost
      - action: notify.mobile_app_alain_gsm
        data:
          message: Attention, possible coupure électrique pour l'appartement
      - action: notify.mobile_app_alain_gsm
        data:
          message: TTS
          data:
            tts_text: Attention, possible coupure électrique pour l'appartement
            media_stream: alarm_stream
            ttl: 0
            priority: high
      - action: notify.mobile_app_alain_tablette
        data:
          message: Attention, possible coupure électrique pour l'appartement
# si c'est l'onduleur NAS/BLUE qui vient de déclencher
  - if:
    - condition: template
      value_template:  "{{ (trigger.entity_id == 'sensor.onduleur_nas_status') }}"
    then:
      - action: python_script.exec
        data_template:
          file: python_scripts/set_state.py
          cache: true
          entity_id: sensor.onduleur_nas_lastaclost
          state: '{{ now() }}'
      - action: saver.save_state
        data:
          entity_id: sensor.onduleur_nas_lastaclost
      - action: notify.mobile_app_alain_gsm
        data:
          message: Attention, possible coupure électrique pour le studio
      - action: notify.mobile_app_alain_gsm
        data:
          message: TTS
          data:
            tts_text: Attention, possible coupure électrique pour le studio
            media_stream: alarm_stream
            ttl: 0
            priority: high
      - action: notify.mobile_app_alain_tablette
        data:
          message: Attention, possible coupure électrique pour le studio
  mode: queued
Et voici le code de la carte.
type: custom:stack-in-card
mode: vertical
keep:
  box_shadow: true
  margin: true
  border_radius: true
  background: true
  outer_padding: false
cards:
  - type: vertical-stack
    cards:
      - type: picture-elements
        image: /local/images/powerwalker800vabis.png
        card_mod:
          style: |
            ha-card {
              border: none;
              max-width: 65% !important;
              margin-left: auto;
              margin-right: auto;
            }
        elements:
          - type: image
            style:
              top: 35%
              left: 88%
              width: 30%
            image: /local/images/TS-664.png
            aspect_ratio: 80%
          - type: image
            style:
              top: 75%
              left: 88%
              width: 30%
            image: /local/images/blue.png
            aspect_ratio: 60%
          - type: icon
            entity: sensor.onduleur_nas_status_data
            style:
              top: 45%
              left: 18%
              color: green
              "--mdc-icon-size": 100px
            card_mod:
              style: |
                ha-icon {
                  {% if states('sensor.onduleur_nas_status_data') == "OB" %}
                    color: red;
                    animation: blink 1s ease infinite;
                    --card-mod-icon: mdi:transmission-tower-off;
                  {% else %}
                    --card-mod-icon: mdi:transmission-tower-export;
                  {% endif %};
                }
                @keyframes blink {
                    0% {
                      opacity: 1;
                    }
                    50% {
                      opacity: 0;
                    }
                    100% {
                      opacity: 1;
                    }
                  }
            icon: mdi:transmission-tower-export
          - type: icon
            style:
              top: 55%
              left: 71%
              color: green
              "--mdc-icon-size": 38px
            icon: mdi:arrow-right-bold
      - type: entities
        entities:
          - entity: sensor.onduleur_nas_lastaclost
            type: custom:multiple-entity-row
            show_state: false
            entities:
              - entity: sensor.onduleur_nas_lastaclost
                name: " "
                format: null
            name: La dernière coupure EDF date du
            icon: null
        card_mod:
          style: |
            :host {
              font-size: 15px;
            }
            .card-content div {
              margin-top: -15px !important;
              margin-right: -5px !important;
              margin-left: -18px !important;
            }
            ha-card {
              --mdc-icon-size: 26px;
              max-height: 40px !important;
              display: flex;
              justify-content: center;
              margin-top: 7px;
            }
  - type: vertical-stack
    cards:
      - type: horizontal-stack
        cards:
          - type: custom:bar-card
            entities:
              - entity: sensor.onduleur_nas_battery_charge
                name: Etat batterie
                icon: mdi:battery
                color: rgb(68, 115, 158)
                height: 27px
                min: "0"
                max: "100"
                target: "90"
                positions:
                  name: inside
                  indicator: "off"
            card_mod:
              style: |
                #states > bar-card-row > bar-card-card
                 {
                  align-items: center !important;
                 }
                ha-card {
                  max-height: 46px !important;
                  display: flex;
                  justify-content: center;
                }
                bar-card-currentbar, bar-card-backgroundbar {
                  border-radius: 4px;
                }
                ha-icon {
                  --mdc-icon-size: 26px;
                }
                bar-card-name {
                  margin: 2px;
                }
                .card-content div {
                  margin-right: -5px !important;
                  margin-left: -18px !important;
                }
          - type: custom:bar-card
            entities:
              - entity: sensor.onduleur_nas_load
                name: Charge délivrée
                icon: mdi:power-plug
                height: 27px
                color: orange
                min: "0"
                max: "100"
                target: "0"
                positions:
                  name: inside
                  indicator: "off"
            card_mod:
              style: |
                #states > bar-card-row > bar-card-card
                 {
                  align-items: center !important;
                 }
                ha-card {
                  max-height: 46px !important;
                  display: flex;
                  justify-content: center;
                }
                bar-card-currentbar, bar-card-backgroundbar {
                  border-radius: 4px;
                }
                ha-icon {
                  --mdc-icon-size: 26px;
                }
                bar-card-name {
                  margin: 2px;
                }
  - type: vertical-stack
    cards:
      - type: horizontal-stack
        cards:
          - type: custom:bar-card
            entities:
              - entity: sensor.onduleur_nas_battery_voltage
                name: Voltage batterie
                icon: mdi:car-battery
                height: 27px
                color: grey
                min: "11"
                max: "14"
                target: "13"
                positions:
                  name: inside
                  indicator: "off"
            card_mod:
              style: |
                #states > bar-card-row > bar-card-card
                 {
                  align-items: center !important;
                 }
                ha-card {
                  max-height: 46px !important;
                  display: flex;
                  justify-content: center;
                }
                bar-card-currentbar, bar-card-backgroundbar {
                  border-radius: 4px;
                }
                ha-icon {
                  --mdc-icon-size: 26px;
                }
                bar-card-name {
                  margin: 2px;
                }
card_mod:
  style: |
    ha-card {
      box-shadow: 0 0 0 1px gray;
    }
Et voici pour la carte qui gère le BLUE qui héberge HA :

type: custom:stack-in-card
mode: vertical
keep:
  box_shadow: true
  margin: true
  border_radius: true
  background: true
  outer_padding: false
cards:
  - type: vertical-stack
    cards:
      - type: picture
        image: /local/images/blue.png
        card_mod:
          style: |
            ha-card {
              border: none;
              max-width: 45% !important;
              margin-left: auto;
              margin-right: auto;
            }
      - type: entities
        entities:
          - entity: sensor.last_boot
            type: custom:multiple-entity-row
            show_state: false
            entities:
              - entity: sensor.last_boot
                name: " "
                format: null
            name: Le dernier boot date du
            icon: null
        card_mod:
          style: |
            :host {
              font-size: 15px;
            }
            .card-content div {
              margin-top: -15px !important;
              margin-right: 20px !important;
            }
            ha-card {
              --mdc-icon-size: 26px;
              max-height: 40px !important;
              display: flex;
              justify-content: center;
              margin-top: 7px;
            }
  - type: vertical-stack
    cards:
      - type: horizontal-stack
        cards:
          - type: custom:bar-card
            entities:
              - entity: sensor.processor_use_percent
                name: CPU Use
                icon: mdi:cpu-64-bit
                color: rgb(68, 115, 158)
                height: 27px
                min: "0"
                max: "100"
                target: "90"
                positions:
                  name: inside
                  indicator: "off"
            card_mod:
              style: |
                #states > bar-card-row > bar-card-card
                 {
                  align-items: center !important;
                 }
                ha-card {
                  max-height: 46px !important;
                  display: flex;
                  justify-content: center;
                }
                bar-card-currentbar, bar-card-backgroundbar {
                  border-radius: 4px;
                }
                ha-icon {
                  --mdc-icon-size: 26px;
                }
                bar-card-name {
                  margin: 2px;
                }
          - type: custom:bar-card
            entities:
              - entity: sensor.processor_temperature
                name: CPU Temp
                icon: mdi:thermometer
                height: 27px
                color: orange
                min: "1"
                max: "80"
                target: "65"
                positions:
                  name: inside
                  indicator: "off"
            card_mod:
              style: |
                #states > bar-card-row > bar-card-card
                 {
                  align-items: center !important;
                 }
                ha-card {
                  max-height: 46px !important;
                  display: flex;
                  justify-content: center;
                }
                bar-card-currentbar, bar-card-backgroundbar {
                  border-radius: 4px;
                }
                ha-icon {
                  --mdc-icon-size: 26px;
                }
                bar-card-name {
                  margin: 2px;
                }
  - type: vertical-stack
    cards:
      - type: horizontal-stack
        cards:
          - type: custom:bar-card
            entities:
              - entity: sensor.memory_use_percent
                name: RAM Use
                icon: phu:ram-memory
                height: 27px
                color: red
                min: "0"
                max: "100"
                target: "90"
                positions:
                  name: inside
                  indicator: "off"
            card_mod:
              style: |
                #states > bar-card-row > bar-card-card
                 {
                  align-items: center !important;
                 }
                ha-card {
                  max-height: 46px !important;
                  display: flex;
                  justify-content: center;
                }
                ha-icon {
                  --mdc-icon-size: 26px;
                }
                bar-card-currentbar, bar-card-backgroundbar {
                  border-radius: 4px;
                }
                bar-card-name {
                  margin: 2px;
                }
          - type: custom:bar-card
            entities:
              - entity: sensor.memory_free
                name: RAM Free
                icon: phu:ram-memory
                color: rgb(31, 111, 235)
                height: 27px
                min: "1"
                max: "4096"
                target: "500"
                positions:
                  name: inside
                  indicator: "off"
            card_mod:
              style: |
                #states > bar-card-row > bar-card-card
                 {
                  align-items: center !important;
                 }
                ha-card {
                  max-height: 46px !important;
                  display: flex;
                  justify-content: center;
                }
                ha-icon {
                  --mdc-icon-size: 26px;
                }
                bar-card-currentbar, bar-card-backgroundbar {
                  border-radius: 4px;
                }
                bar-card-name {
                  margin: 2px;
                }
  - type: vertical-stack
    cards:
      - type: horizontal-stack
        cards:
          - type: custom:bar-card
            entities:
              - entity: sensor.disk_use_percent
                name: eMMC 128Go
                icon: mdi:harddisk
                height: 27px
                color: grey
                min: "0"
                max: "100"
                target: "75"
                positions:
                  name: inside
                  indicator: "off"
            card_mod:
              style: |
                #states > bar-card-row > bar-card-card
                 {
                  align-items: center !important;
                 }
                ha-card {
                  max-height: 46px !important;
                  display: flex;
                  justify-content: center;
                }
                bar-card-currentbar, bar-card-backgroundbar {
                  border-radius: 4px;
                }
                ha-icon {
                  --mdc-icon-size: 26px;
                }
                bar-card-name {
                  margin: 2px;
                }
  - type: custom:popup-card
    entity: sensor.processor_use_percent
    style: |-
      --popup-border-radius: 10px;
      --popup-background-color: transparent;
      --popup-border-width: 0px;
      --popup-min-width: 500px;
      --popup-max-width: 600px;
    card:
      type: custom:apexcharts-card
      graph_span: 1d
      yaxis:
        - id: first
          apex_config:
            decimalsInFloat: 1
            title:
              text: Taux d'occupation
      header:
        show: true
        title: Usage CPU - Moyenne sur 15min
        show_states: false
        colorize_states: true
      series:
        - entity: sensor.processor_use_percent
          name: "%CPU"
          type: line
          yaxis_id: first
          stroke_width: 4
          show:
            extremas: true
          group_by:
            func: avg
            duration: 15min
  - type: custom:popup-card
    entity: sensor.processor_temperature
    style: |-
      --popup-border-radius: 10px;
      --popup-background-color: transparent;
      --popup-border-width: 0px;
      --popup-min-width: 500px;
      --popup-max-width: 600px;
    card:
      type: custom:apexcharts-card
      graph_span: 1d
      yaxis:
        - id: first
          apex_config:
            decimalsInFloat: 1
            title:
              text: Température
      header:
        show: true
        title: Température CPU - Moyenne sur 15min
        show_states: false
        colorize_states: true
      series:
        - entity: sensor.processor_temperature
          name: °C
          type: line
          yaxis_id: first
          stroke_width: 4
          show:
            extremas: true
          group_by:
            func: avg
            duration: 15min
  - type: custom:popup-card
    entity: sensor.memory_use_percent
    style: |-
      --popup-border-radius: 10px;
      --popup-background-color: transparent;
      --popup-border-width: 0px;
      --popup-min-width: 500px;
      --popup-max-width: 600px;
    card:
      type: custom:apexcharts-card
      graph_span: 1d
      yaxis:
        - id: first
          min: 0
          max: 100
          apex_config:
            decimalsInFloat: 0
            title:
              text: Taux d'occupation
        - id: second
          apex_config:
            decimalsInFloat: 1
            title:
              text: Mo libres
          show: true
          opposite: true
      header:
        show: true
        title: Usage RAM - Moyenne sur 15min
        show_states: false
        colorize_states: true
      series:
        - entity: sensor.memory_free
          name: RAM libre
          type: line
          yaxis_id: second
          stroke_width: 4
          show:
            extremas: true
          group_by:
            func: avg
            duration: 15min
        - entity: sensor.memory_use_percent
          name: "%RAM"
          type: line
          yaxis_id: first
          stroke_width: 4
          show:
            extremas: true
          group_by:
            func: avg
            duration: 15min
  - type: custom:popup-card
    entity: sensor.memory_free
    style: |-
      --popup-border-radius: 10px;
      --popup-background-color: transparent;
      --popup-border-width: 0px;
      --popup-min-width: 500px;
      --popup-max-width: 600px;
    card:
      type: custom:apexcharts-card
      graph_span: 1d
      yaxis:
        - id: first
          min: 0
          max: 100
          apex_config:
            decimalsInFloat: 0
            title:
              text: Taux d'occupation
        - id: second
          apex_config:
            decimalsInFloat: 1
            title:
              text: Mo libres
          show: true
          opposite: true
      header:
        show: true
        title: Usage RAM - Moyenne sur 15min
        show_states: false
        colorize_states: true
      series:
        - entity: sensor.memory_free
          name: RAM libre
          type: line
          yaxis_id: second
          stroke_width: 4
          show:
            extremas: true
          group_by:
            func: avg
            duration: 15min
        - entity: sensor.memory_use_percent
          name: "%RAM"
          type: line
          yaxis_id: first
          stroke_width: 4
          show:
            extremas: true
          group_by:
            func: avg
            duration: 15min
card_mod:
  style: |
    ha-card {
      box-shadow: 0 0 0 1px gray;
    }
Carte qui gère mon NAS TS-664

type: custom:stack-in-card
mode: vertical
keep:
box_shadow: true
margin: true
border_radius: true
background: true
outer_padding: false
cards:
- type: vertical-stack
cards:
- type: picture-elements
image: /local/images/TS-664.png
card_mod:
style: |
ha-card {
border: none;
max-width: 46% !important;
margin-left: auto;
margin-right: auto;
margin-top: 10px;
}
elements:
- style:
color: white
top: 12%
left: 9%
width: 14%
type: image
entity: sensor.nas01_etat
tap_action:
action: none
state_image:
good: /local/images/good.png
warning: /local/images/bad.png
- style:
top: 6%
left: 84%
font-size: 170%
type: state-label
card_mod:
style: >
{% set temp = states('sensor.nas01_temperature_du_systeme') |
int %}
{% if temp > 50 %}
div {color: red;}
{% elif temp > 46 %}
div {color: orange;}
{% elif temp > 42 %}
div {color: yellow;}
{% else %}
div {color: green;}
{% endif %}
entity: sensor.nas01_temperature_du_systeme
- type: custom:popup-card
entity: sensor.nas01_temperature_du_systeme
style: |-
--popup-border-radius: 10px;
--popup-background-color: transparent;
--popup-border-width: 0px;
--popup-min-width: 500px;
--popup-max-width: 600px;
card:
type: custom:apexcharts-card
graph_span: 2d
yaxis:
- id: first
min: 0
max: 60
apex_config:
decimalsInFloat: 0
title:
text: Température
header:
show: true
title: Température moyenne sur 15 min du NAS
show_states: false
colorize_states: true
series:
- entity: sensor.nas01_temperature_du_systeme
type: line
yaxis_id: first
stroke_width: 4
show:
extremas: true
group_by:
func: avg
duration: 15min
- type: entities
entities:
- entity: sensor.nas01_uptime
type: custom:multiple-entity-row
show_state: false
entities:
- entity: sensor.nas01_uptime
name: " "
format: null
name: Le dernier boot date du
icon: null
card_mod:
style: |
.card-content div {
margin-top: -15px !important;
margin-left: -15px !important;
margin-bottom: 25px !important;
}
:host {
font-size: 15px;
}
ha-card {
--mdc-icon-size: 24px;
max-height: 44px !important;
display: flex;
justify-content: center;
margin-top: -7px;
}
- type: vertical-stack
cards:
- type: horizontal-stack
cards:
- type: custom:bar-card
entities:
- entity: sensor.nas01_utilisation_du_processeur
name: CPU Use
icon: mdi:cpu-64-bit
color: rgb(68, 115, 158)
height: 27px
min: "0"
max: "100"
target: "90"
positions:
name: inside
indicator: "off"
card_mod:
style: |
#states > bar-card-row > bar-card-card
{
align-items: center !important;
}
ha-card {
max-height: 46px !important;
display: flex;
justify-content: center;
}
bar-card-currentbar, bar-card-backgroundbar {
border-radius: 4px;
}
ha-icon {
--mdc-icon-size: 30px;
}
bar-card-name {
margin: 2px;
}
- type: custom:bar-card
entities:
- entity: sensor.nas01_temperature_du_processeur
name: CPU Temp
icon: mdi:thermometer
height: 27px
color: orange
min: "1"
max: "80"
target: "65"
positions:
name: inside
indicator: "off"
card_mod:
style: |
#states > bar-card-row > bar-card-card
{
align-items: center !important;
}
ha-card {
max-height: 46px !important;
display: flex;
justify-content: center;
}
bar-card-currentbar, bar-card-backgroundbar {
border-radius: 4px;
}
ha-icon {
--mdc-icon-size: 28px;
}
bar-card-name {
margin: 2px;
}
- type: vertical-stack
cards:
- type: horizontal-stack
cards:
- type: custom:bar-card
entities:
- entity: sensor.nas01_utilisation_de_la_memoire
decimal: 1
name: RAM Use
icon: phu:ram-memory
height: 27px
color: red
min: "0"
max: "100"
target: "90"
positions:
name: inside
indicator: "off"
card_mod:
style: |
#states > bar-card-row > bar-card-card
{
align-items: center !important;
}
ha-card {
max-height: 46px !important;
display: flex;
justify-content: center;
}
ha-icon {
--mdc-icon-size: 30px;
}
bar-card-currentbar, bar-card-backgroundbar {
border-radius: 4px;
}
bar-card-name {
margin: 2px;
}
- type: custom:bar-card
entities:
- entity: sensor.nas01_memoire_disponible
name: RAM Free
decimal: 1
icon: phu:ram-memory
color: rgb(31, 111, 235)
height: 27px
min: "1"
max: "8"
target: "6.5"
positions:
name: inside
indicator: "off"
card_mod:
style: |
#states > bar-card-row > bar-card-card
{
align-items: center !important;
}
ha-card {
max-height: 46px !important;
display: flex;
justify-content: center;
}
ha-icon {
--mdc-icon-size: 30px;
}
bar-card-currentbar, bar-card-backgroundbar {
border-radius: 4px;
}
bar-card-name {
margin: 2px;
}
- type: vertical-stack
cards:
- type: horizontal-stack
cards:
- type: custom:bar-card
entities:
- entity: sensor.nas01_volume_utilise_datavol1
name: Datavol01
decimal: 1
icon: mdi:harddisk
height: 27px
color: grey
min: "0"
max: "100"
target: "75"
positions:
name: inside
indicator: "off"
card_mod:
style: |
#states > bar-card-row > bar-card-card
{
align-items: center !important;
}
ha-card {
max-height: 46px !important;
display: flex;
justify-content: center;
}
bar-card-currentbar, bar-card-backgroundbar {
border-radius: 4px;
}
ha-icon {
--mdc-icon-size: 28px;
}
bar-card-name {
margin: 2px;
}
- type: custom:popup-card
entity: sensor.nas01_utilisation_du_processeur
style: |-
--popup-border-radius: 10px;
--popup-background-color: transparent;
--popup-border-width: 0px;
--popup-min-width: 500px;
--popup-max-width: 600px;
card:
type: custom:apexcharts-card
graph_span: 2d
yaxis:
- id: first
apex_config:
decimalsInFloat: 1
title:
text: Taux d'occupation
header:
show: true
title: Usage CPU - Moyenne sur 15min
show_states: false
colorize_states: true
series:
- entity: sensor.nas01_utilisation_du_processeur
name: "%RAM"
type: line
yaxis_id: first
stroke_width: 4
show:
extremas: true
group_by:
func: avg
duration: 15min
- type: custom:popup-card
entity: sensor.nas01_temperature_du_processeur
style: |-
--popup-border-radius: 10px;
--popup-background-color: transparent;
--popup-border-width: 0px;
--popup-min-width: 500px;
--popup-max-width: 600px;
card:
type: custom:apexcharts-card
graph_span: 2d
yaxis:
- id: first
apex_config:
decimalsInFloat: 1
title:
text: Température
header:
show: true
title: Température CPU - Moyenne sur 15min
show_states: false
colorize_states: true
series:
- entity: sensor.nas01_temperature_du_processeur
name: °C
type: line
yaxis_id: first
stroke_width: 4
show:
extremas: true
group_by:
func: avg
duration: 15min
- type: custom:popup-card
entity: sensor.nas01_utilisation_de_la_memoire
style: |-
--popup-border-radius: 10px;
--popup-background-color: transparent;
--popup-border-width: 0px;
--popup-min-width: 500px;
--popup-max-width: 600px;
card:
type: custom:apexcharts-card
graph_span: 2d
yaxis:
- id: first
min: 0
max: 100
apex_config:
decimalsInFloat: 0
title:
text: Taux d'occupation
- id: second
apex_config:
decimalsInFloat: 1
title:
text: Go libres
show: true
opposite: true
header:
show: true
title: Usage RAM - Moyenne sur 15min
show_states: false
colorize_states: true
series:
- entity: sensor.nas01_memoire_disponible
name: RAM libre
type: line
yaxis_id: second
stroke_width: 4
show:
extremas: true
group_by:
func: avg
duration: 15min
- entity: sensor.nas01_utilisation_de_la_memoire
name: "%RAM"
type: line
yaxis_id: first
stroke_width: 4
show:
extremas: true
group_by:
func: avg
duration: 15min
- type: custom:popup-card
entity: sensor.nas01_memoire_disponible
style: |-
--popup-border-radius: 10px;
--popup-background-color: transparent;
--popup-border-width: 0px;
--popup-min-width: 500px;
--popup-max-width: 600px;
card:
type: custom:apexcharts-card
graph_span: 2d
yaxis:
- id: first
min: 0
max: 100
apex_config:
decimalsInFloat: 0
title:
text: Taux d'occupation
- id: second
apex_config:
decimalsInFloat: 1
title:
text: Go libres
show: true
opposite: true
header:
show: true
title: Usage RAM - Moyenne sur 15min
show_states: false
colorize_states: true
series:
- entity: sensor.nas01_memoire_disponible
name: RAM libre
type: line
yaxis_id: second
stroke_width: 4
show:
extremas: true
group_by:
func: avg
duration: 15min
- entity: sensor.nas01_utilisation_de_la_memoire
name: "%RAM"
type: line
yaxis_id: first
stroke_width: 4
show:
extremas: true
group_by:
func: avg
duration: 15min
- type: custom:popup-card
entity: sensor.nas01_volume_utilise_datavol1
style: |-
--popup-border-radius: 10px;
--popup-background-color: transparent;
--popup-border-width: 0px;
--popup-min-width: 500px;
--popup-max-width: 600px;
card:
type: custom:apexcharts-card
graph_span: 2d
yaxis:
- id: first
min: 0
max: 100
apex_config:
decimalsInFloat: 0
title:
text: Taux d'occupation
- id: second
apex_config:
decimalsInFloat: 1
title:
text: Go libres
show: true
opposite: true
header:
show: true
title: Usage disques - Moyenne sur 15min
show_states: false
colorize_states: true
series:
- entity: sensor.nas01_espace_libre_datavol1
name: Disque libre
type: line
yaxis_id: second
stroke_width: 4
show:
extremas: true
group_by:
func: avg
duration: 15min
- entity: sensor.nas01_volume_utilise_datavol1
name: "%Disque"
type: line
yaxis_id: first
stroke_width: 4
show:
extremas: true
group_by:
func: avg
duration: 15min
- type: horizontal-stack
cards:
- type: custom:vertical-stack-in-card
card_mod:
style: |
ha-card {
top: -41px;
}
cards:
- type: picture-elements
image: /local/images/HDD-WD-RED.png
title: HDD 1
card_mod:
style:
$: |
.card-header {
font-size: 18px !important;
}
h1.card-header {
margin-top: -18px;
}
elements:
- style:
color: white
top: 67%
left: 48%
width: 37%
type: image
entity: sensor.nas01_etat_du_lecteur_0_3
tap_action:
action: none
state_image:
OK: /local/images/good.png
KO: /local/images/bad.png
- style:
top: "-16%"
left: 46%
font-size: 140%
type: state-label
card_mod:
style: >
{% set temp =
states('sensor.nas01_temperature_du_lecteur_0_3') | int %}
{% if temp > 50 %}
div {color: red;}
{% elif temp > 46 %}
div {color: orange;}
{% elif temp > 42 %}
div {color: yellow;}
{% else %}
div {color: green;}
{% endif %}
entity: sensor.nas01_temperature_du_lecteur_0_3
- type: custom:popup-card
entity: sensor.nas01_temperature_du_lecteur_0_3
style: |-
--popup-border-radius: 10px;
--popup-background-color: transparent;
--popup-border-width: 0px;
--popup-min-width: 500px;
--popup-max-width: 600px;
card:
type: custom:apexcharts-card
graph_span: 2d
yaxis:
- id: first
min: 0
max: 60
apex_config:
decimalsInFloat: 0
title:
text: Température
header:
show: true
title: Température moyenne sur 15 min du disque 1
show_states: false
colorize_states: true
series:
- entity: sensor.nas01_temperature_du_lecteur_0_3
type: line
yaxis_id: first
stroke_width: 4
show:
extremas: true
group_by:
func: avg
duration: 15min
- type: custom:vertical-stack-in-card
card_mod:
style: |
ha-card {
top: -41px;
}
cards:
- type: picture-elements
image: /local/images/HDD-WD-RED.png
title: HDD 2
card_mod:
style:
$: |
.card-header {
font-size: 18px !important;
}
h1.card-header {
margin-top: -18px;
}
elements:
- style:
color: white
top: 67%
left: 48%
width: 37%
type: image
entity: sensor.nas01_etat_du_lecteur_0_4
tap_action:
action: none
state_image:
OK: /local/images/good.png
KO: /local/images/bad.png
- style:
top: "-16%"
left: 46%
font-size: 140%
type: state-label
card_mod:
style: >
{% set temp =
states('sensor.nas01_temperature_du_lecteur_0_4') | int %}
{% if temp > 50 %}
div {color: red;}
{% elif temp > 46 %}
div {color: orange;}
{% elif temp > 42 %}
div {color: yellow;}
{% else %}
div {color: green;}
{% endif %}
entity: sensor.nas01_temperature_du_lecteur_0_4
- type: custom:popup-card
entity: sensor.nas01_temperature_du_lecteur_0_4
style: |-
--popup-border-radius: 10px;
--popup-background-color: transparent;
--popup-border-width: 0px;
--popup-min-width: 500px;
--popup-max-width: 600px;
card:
type: custom:apexcharts-card
graph_span: 2d
yaxis:
- id: first
min: 0
max: 60
apex_config:
decimalsInFloat: 0
title:
text: Température
header:
show: true
title: Température moyenne sur 15 min du disque 2
show_states: false
colorize_states: true
series:
- entity: sensor.nas01_temperature_du_lecteur_0_4
type: line
yaxis_id: first
stroke_width: 4
show:
extremas: true
group_by:
func: avg
duration: 15min
- type: custom:vertical-stack-in-card
card_mod:
style: |
ha-card {
top: -41px;
}
cards:
- type: picture-elements
image: /local/images/HDD-WD-RED.png
title: HDD 3
card_mod:
style:
$: |
.card-header {
font-size: 18px !important;
}
h1.card-header {
margin-top: -18px;
}
elements:
- style:
color: white
top: 67%
left: 48%
width: 37%
type: image
entity: sensor.nas01_etat_du_lecteur_0_5
tap_action:
action: none
state_image:
OK: /local/images/good.png
KO: /local/images/bad.png
- style:
top: "-16%"
left: 46%
font-size: 140%
type: state-label
card_mod:
style: >
{% set temp =
states('sensor.nas01_temperature_du_lecteur_0_5') | int %}
{% if temp > 50 %}
div {color: red;}
{% elif temp > 46 %}
div {color: orange;}
{% elif temp > 42 %}
div {color: yellow;}
{% else %}
div {color: green;}
{% endif %}
entity: sensor.nas01_temperature_du_lecteur_0_5
- type: custom:popup-card
entity: sensor.nas01_temperature_du_lecteur_0_5
style: |-
--popup-border-radius: 10px;
--popup-background-color: transparent;
--popup-border-width: 0px;
--popup-min-width: 500px;
--popup-max-width: 600px;
card:
type: custom:apexcharts-card
graph_span: 2d
yaxis:
- id: first
min: 0
max: 60
apex_config:
decimalsInFloat: 0
title:
text: Température
header:
show: true
title: Température moyenne sur 15 min du disque 3
show_states: false
colorize_states: true
series:
- entity: sensor.nas01_temperature_du_lecteur_0_5
type: line
yaxis_id: first
stroke_width: 4
show:
extremas: true
group_by:
func: avg
duration: 15min
- type: custom:vertical-stack-in-card
card_mod:
style: |
ha-card {
top: -41px;
}
cards:
- type: picture-elements
image: /local/images/HDD-WD-RED.png
title: HDD 4
card_mod:
style:
$: |
.card-header {
font-size: 18px !important;
}
h1.card-header {
margin-top: -18px;
}
elements:
- style:
color: white
top: 67%
left: 48%
width: 37%
type: image
entity: sensor.nas01_etat_du_lecteur_0_6
tap_action:
action: none
state_image:
OK: /local/images/good.png
KO: /local/images/bad.png
- style:
top: "-16%"
left: 46%
font-size: 140%
type: state-label
card_mod:
style: >
{% set temp =
states('sensor.nas01_temperature_du_lecteur_0_6') | int %}
{% if temp > 50 %}
div {color: red;}
{% elif temp > 46 %}
div {color: orange;}
{% elif temp > 42 %}
div {color: yellow;}
{% else %}
div {color: green;}
{% endif %}
entity: sensor.nas01_temperature_du_lecteur_0_6
- type: custom:popup-card
entity: sensor.nas01_temperature_du_lecteur_0_6
style: |-
--popup-border-radius: 10px;
--popup-background-color: transparent;
--popup-border-width: 0px;
--popup-min-width: 500px;
--popup-max-width: 600px;
card:
type: custom:apexcharts-card
graph_span: 2d
yaxis:
- id: first
min: 0
max: 60
apex_config:
decimalsInFloat: 0
title:
text: Température
header:
show: true
title: Température moyenne sur 15 min du disque 4
show_states: false
colorize_states: true
series:
- entity: sensor.nas01_temperature_du_lecteur_0_6
type: line
yaxis_id: first
stroke_width: 4
show:
extremas: true
group_by:
func: avg
duration: 15min
- type: custom:vertical-stack-in-card
card_mod:
style: |
ha-card {
top: -41px;
}
cards:
- type: picture-elements
image: /local/images/HDD-WD-RED.png
title: HDD 5
card_mod:
style:
$: |
.card-header {
font-size: 18px !important;
top: -10px !important;
}
h1.card-header {
margin-top: -18px;
}
elements:
- style:
color: white
top: 67%
left: 48%
width: 37%
type: image
entity: sensor.nas01_etat_du_lecteur_0_7
tap_action:
action: none
state_image:
OK: /local/images/good.png
KO: /local/images/bad.png
- style:
top: "-16%"
left: 46%
font-size: 140%
type: state-label
entity: sensor.nas01_temperature_du_lecteur_0_7
card_mod:
style: >
{% set temp =
states('sensor.nas01_temperature_du_lecteur_0_7') | int %}
{% if temp > 50 %}
div {color: red;}
{% elif temp > 46 %}
div {color: orange;}
{% elif temp > 42 %}
div {color: yellow;}
{% else %}
div {color: green;}
{% endif %}
- type: custom:popup-card
entity: sensor.nas01_temperature_du_lecteur_0_7
style: |-
--popup-border-radius: 10px;
--popup-background-color: transparent;
--popup-border-width: 0px;
--popup-min-width: 500px;
--popup-max-width: 600px;
card:
type: custom:apexcharts-card
graph_span: 2d
yaxis:
- id: first
min: 0
max: 60
apex_config:
decimalsInFloat: 0
title:
text: Température
header:
show: true
title: Température moyenne sur 15 min du disque 5
show_states: false
colorize_states: true
series:
- entity: sensor.nas01_temperature_du_lecteur_0_7
type: line
yaxis_id: first
stroke_width: 4
show:
extremas: true
group_by:
func: avg
duration: 15min
card_mod:
style: |
ha-card {
box-shadow: 0 0 0 1px gray;
}
Comment vous récupère les clients connectés normalement avec cette intégration la GitHub - cyr-ius/hass-bbox2: Addon HA for Bouygues Bbox router
Je vais peux récupéré les info mais quand je regarde dans le mode dev impossible de voir quel entité a l’attribue
Ça ne doit pas être possible.
Bonjour,
je clôture ce sujet et le met en archive, car trop de message. Si besoin , ouvrir un sujet pour de l’aide.