Aide sur l'adaptation d'une carte mini-graph

Bonjour,

Je suis un fan de mini-graph-card, qui permet beaucoup de choses par rapport aux graphs de base de Lovelace.
Je cherche néanmoins à savoir si je peux faire la chose suivante:
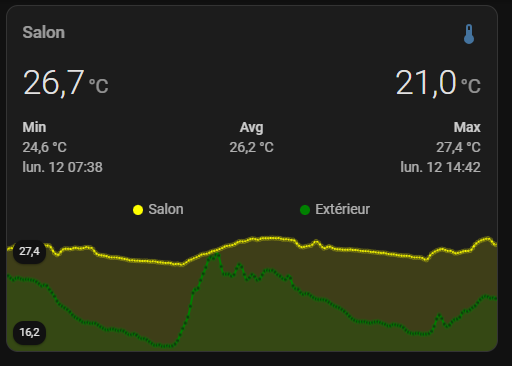
Ci-dessous une carte que j’utilise pour afficher les températures extérieur et intérieur:


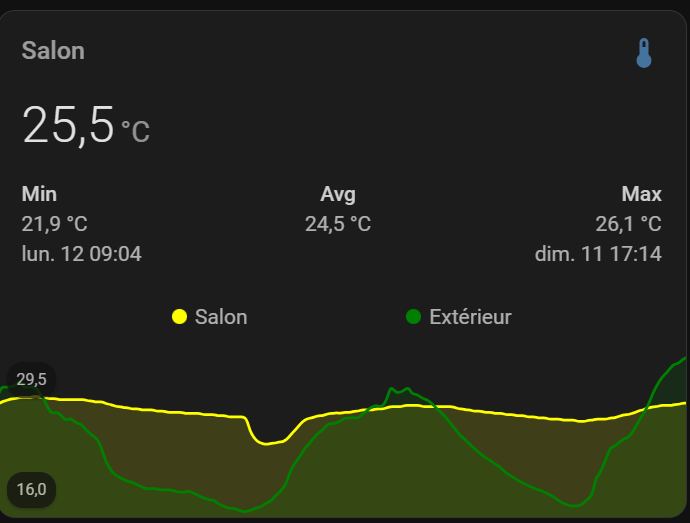
Ce que j’aimerais faire, c’est afficher, de la même manière que « Salon » et « 25,5°C », la température extérieure sur la droite de la carte, aligné à droite.
Par ailleurs, je sais que je peux afficher les min et max de la courbe extérieure à droite en rajoutant un second y-axis, mais du coup l’échelle des deux courbes n’est pa la même. Y-a-t’il myen d’avoir le min et max à droite du graph sans que la courbe change d’échelle?
Ci-dessous le code de la carte:

type: custom:mini-graph-card
name: Salon
height: 120
hours_to_show: 48
points_per_hour: 4
hour24: true
line_width: 2
decimals: 1
entities:
  - entity: sensor.interieur_temperature
    name: Salon
    color: yellow
  - color: green
    entity: sensor.interieur_interieur_interieur_exterieur_temperature
    name: Extérieur
    show_line: true
    show_points: true
    show_legend: true
show:
  fill: true
  graph: line
  icon: true
  name: true
  state: true
  labels: true
  extrema: true
  average: true
  icon_adaptive_color: false
align_icon: right
align_state: left
card_mod:
  style: |
    ha-card .header.flex .name.flex {
      color: rgb(68, 115, 158);
    }
    ha-card .states.flex {
      font-size: 13.5px;
    }
    ha-card .header.flex .icon {
      color: orange;
    }
    ha-card .graph .graph__container .graph__labels {
      color: rgb(68, 115, 158);
    }
    ha-card {
      margin: 0px -10px -30px -10px;
    }

Tu as une erreur dans le Yaml !

entities:
  - entity: sensor.interieur_temperature
    name: Salon
    color: yellow
  - color: green
    entity: sensor.interieur_interieur_interieur_exterieur_temperature
    name: Extérieur

C’est l’entité qui doit être !

’ - entity: sensor.interieur_interieur_interieur_exterieur_temperature :point_left:
et pas
’ - color: green :point_left:

type: custom:mini-graph-card
name: Salon
height: 120
hours_to_show: 48
points_per_hour: 4
hour24: true
line_width: 2
decimals: 1
entities:
  - entity: sensor.interieur_temperature
    name: Salon
    color: yellow
    show_state: true
  - entity: sensor.interieur_interieur_interieur_exterieur_temperature
    color: green
    name: Extérieur
    show_state: true
show:
  fill: true
  graph: line
  icon: true
  name: true
  state: true
  labels: true
  labels_secondary: true
  extrema: true
  average: true
  icon_adaptive_color: false
align_icon: right
align_state: left
card_mod:
  style: |
    ha-card .header.flex .name.flex {
      color: rgb(68, 115, 158);
    }
    ha-card .states.flex {
      font-size: 13.5px;
    }
    ha-card .header.flex .icon {
      color: orange;
    }
    ha-card .graph .graph__container .graph__labels {
      color: rgb(68, 115, 158);
    }
    ha-card {
      margin: 0px -10px -30px -10px;
    }

image

Super et merci Doubledom.
Ce qui me manquait était la variable « show_state ».
Pour parfaire la chose, une idée de comment:

  • centrer l’icone thermomètre ?
  • Ecrire « Extérieur » aligné à droite au-dessus de 21,0°C ?

Hello,

Tu as sur le github pas mal d’infos sur cela:

align_header string default v0.2.0 Set the alignment of the header, left, right, center or default.
align_icon string right v0.2.0 Set the alignment of the icon, left, right or state.
align_state string left v0.2.0 Set the alignment of the current state, left, right or center.