Bonsoir,
J’ai un petit problème depuis un certain moment.
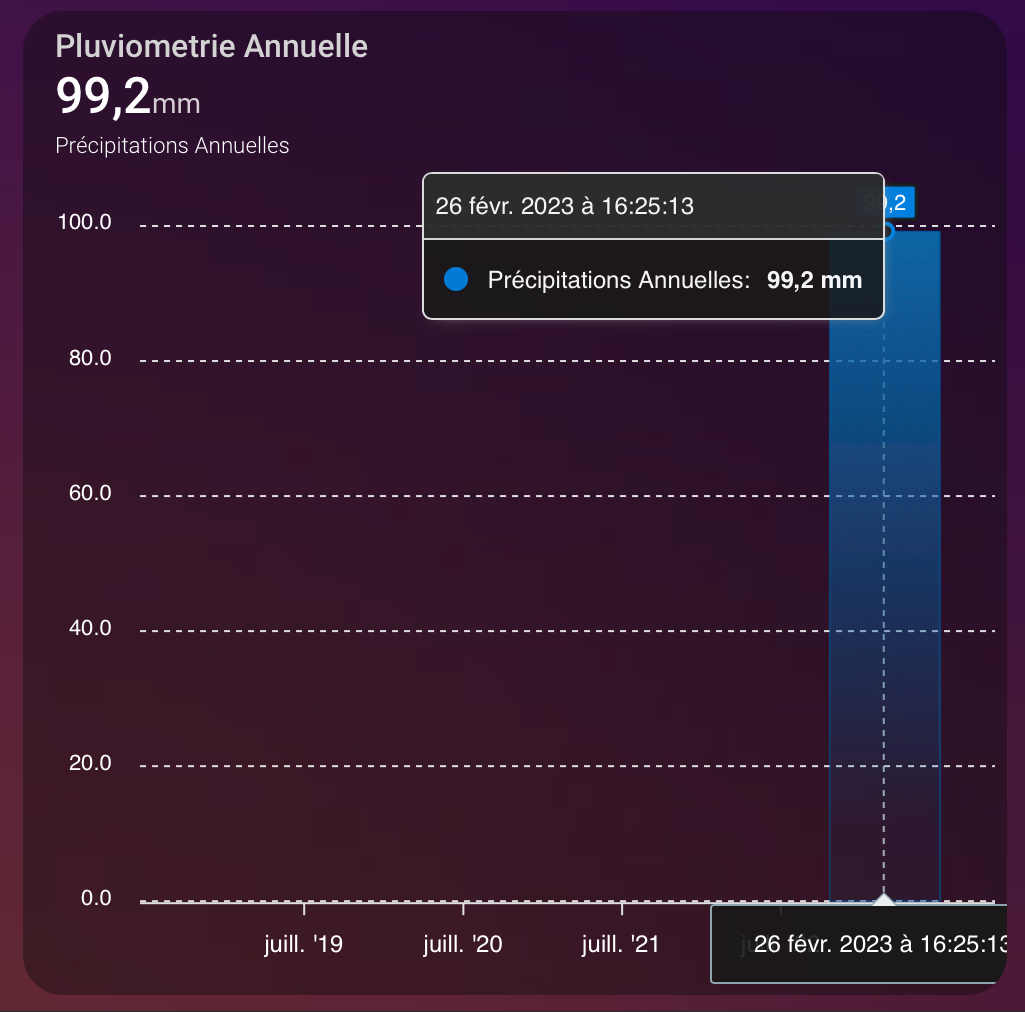
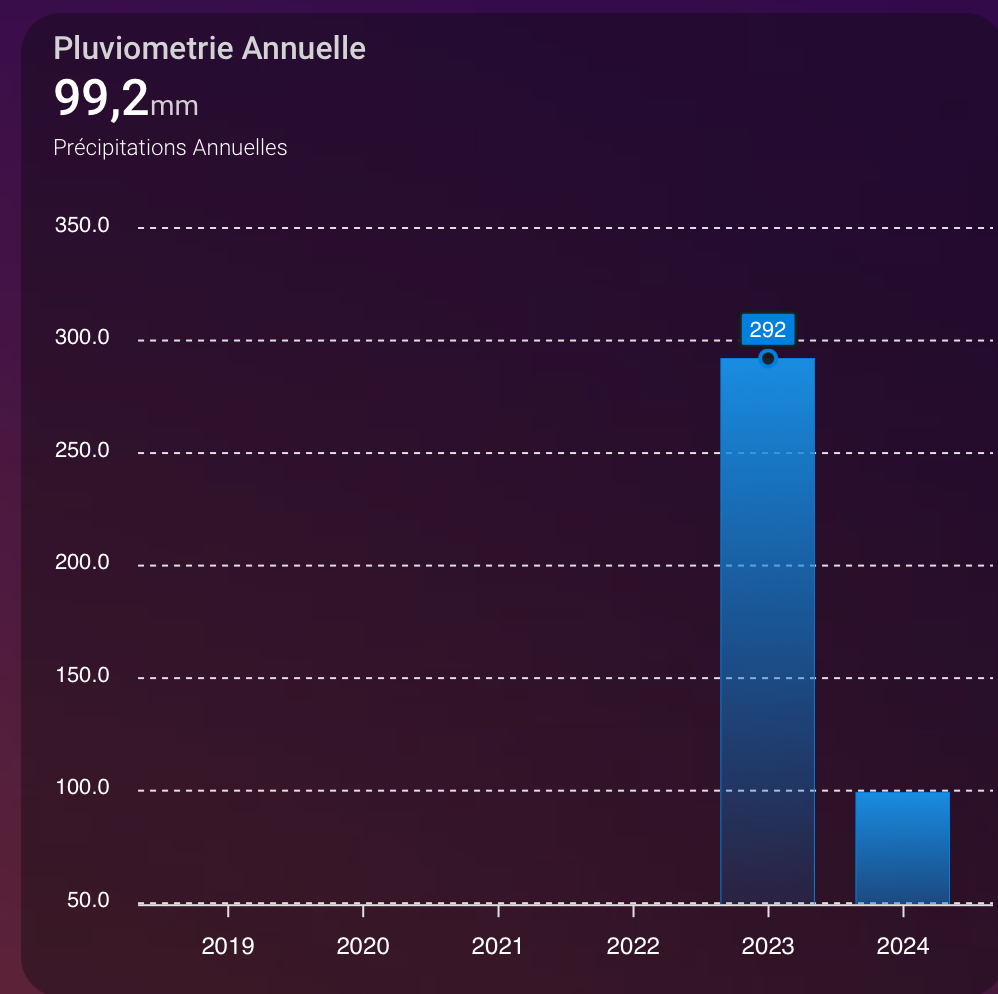
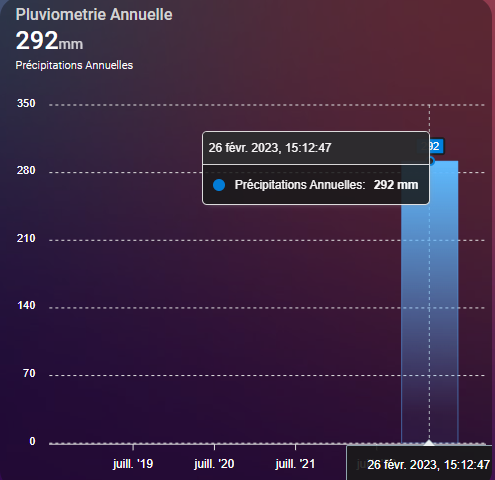
ApexChart ne m’affiche pas la colonne en cours.
Par exemple sur ce graphique ou chaque colonne affiche une année j’ai uniquement la colonne de 2023 (les données commencent en 2023) et non la colonne en cours de 2024…
J’ai ce même problème pour le graphique mensuel…
type: custom:apexcharts-card
graph_span: 5year
header:
  show: true
  title: Pluviometrie Annuelle
  show_states: true
  colorize_states: true
  standard_format: false
apex_config:
  chart:
    type: area
    height: 400
  stroke:
    show: true
    width: 0.5
    curve: smooth
  legend:
    show: true
  fill:
    type: gradient
    gradient:
      shadeIntensity: 0.1
      opacityFrom: 1
      opacityTo: 0.25
      inverseColors: true
      stops:
        - 0
        - 90
        - 100
series:
  - entity: sensor.precipitations_annuelles
    show:
      legend_value: false
      extremas: max
    color: 0080DE
    opacity: 0.3
    stroke_width: 2
    type: column
    group_by:
      duration: 1year
      func: max
    statistics:
      type: state
Merci beaucoup pour votre aide ! ![]()