Le coup de : graph_span: 7d1 c’est !! ENORME !! tickAmount: 6
Et pour mon graph sur la journée, 1d1 me montre alors toutes les heures (il manquait 23h00).
Bon, il me reste des trucs bizarres !
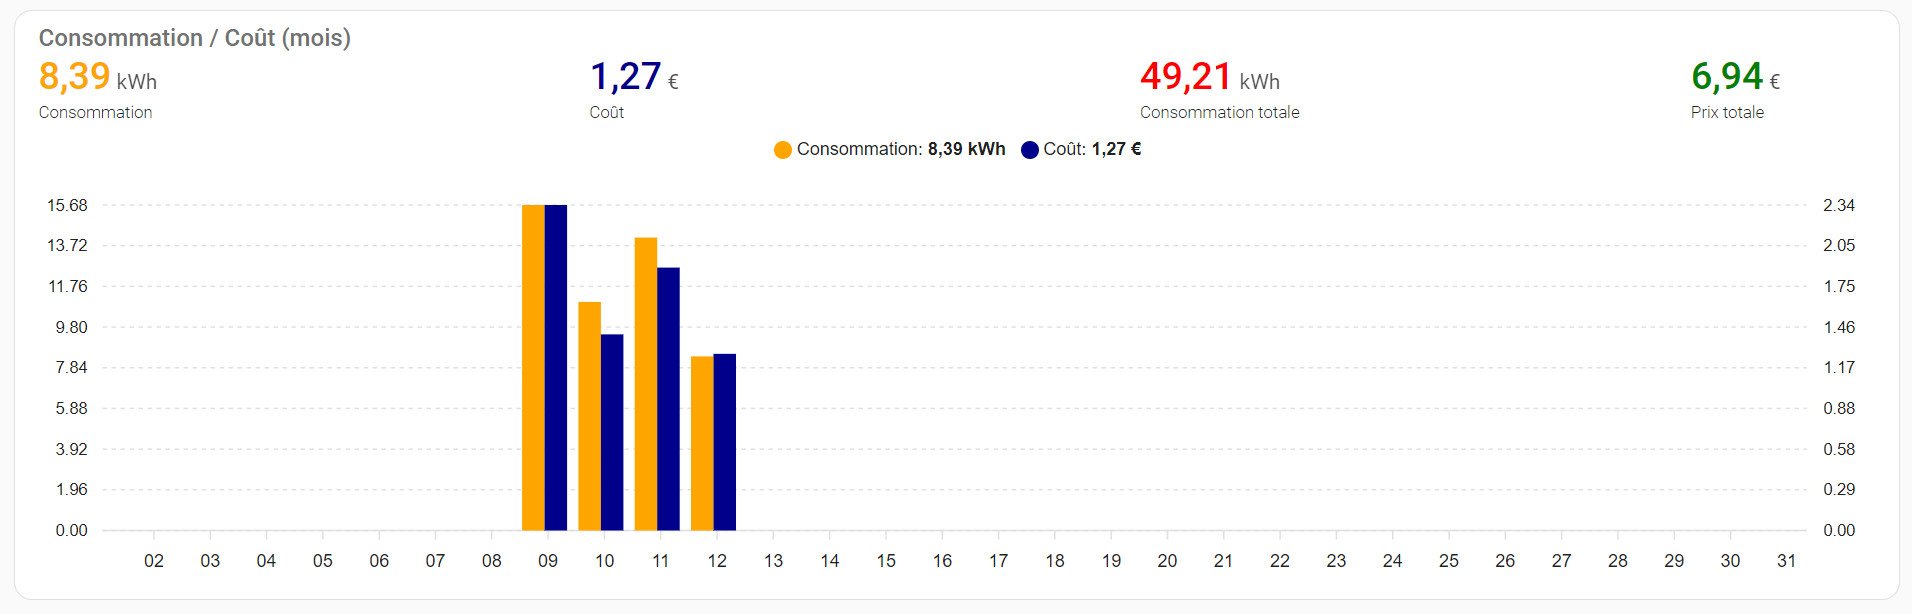
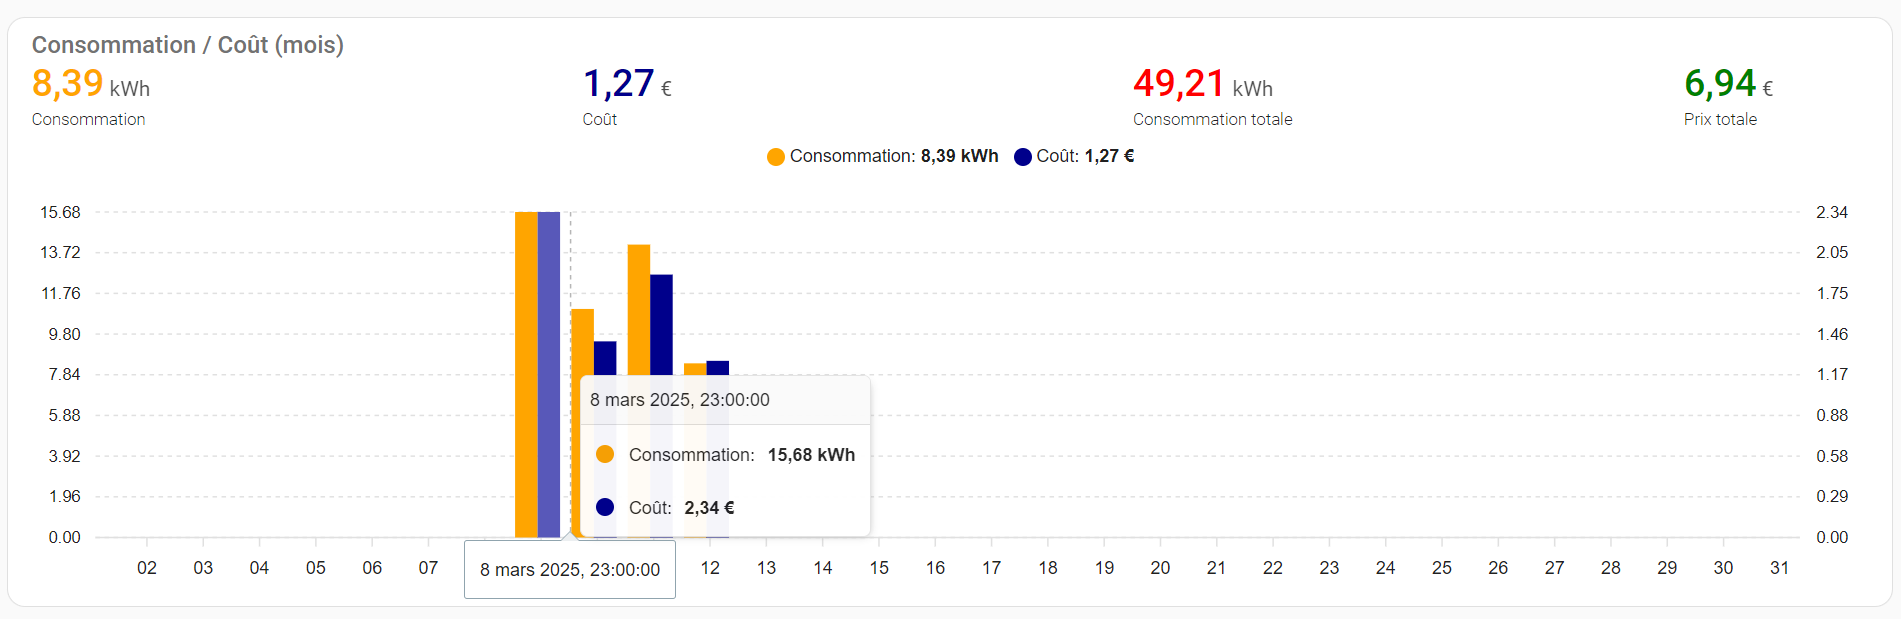
On voit que la donnée est bien positionnée sur le 9 mars (la première barre à gauche):
Mais son infobulle affiche 8 mars.
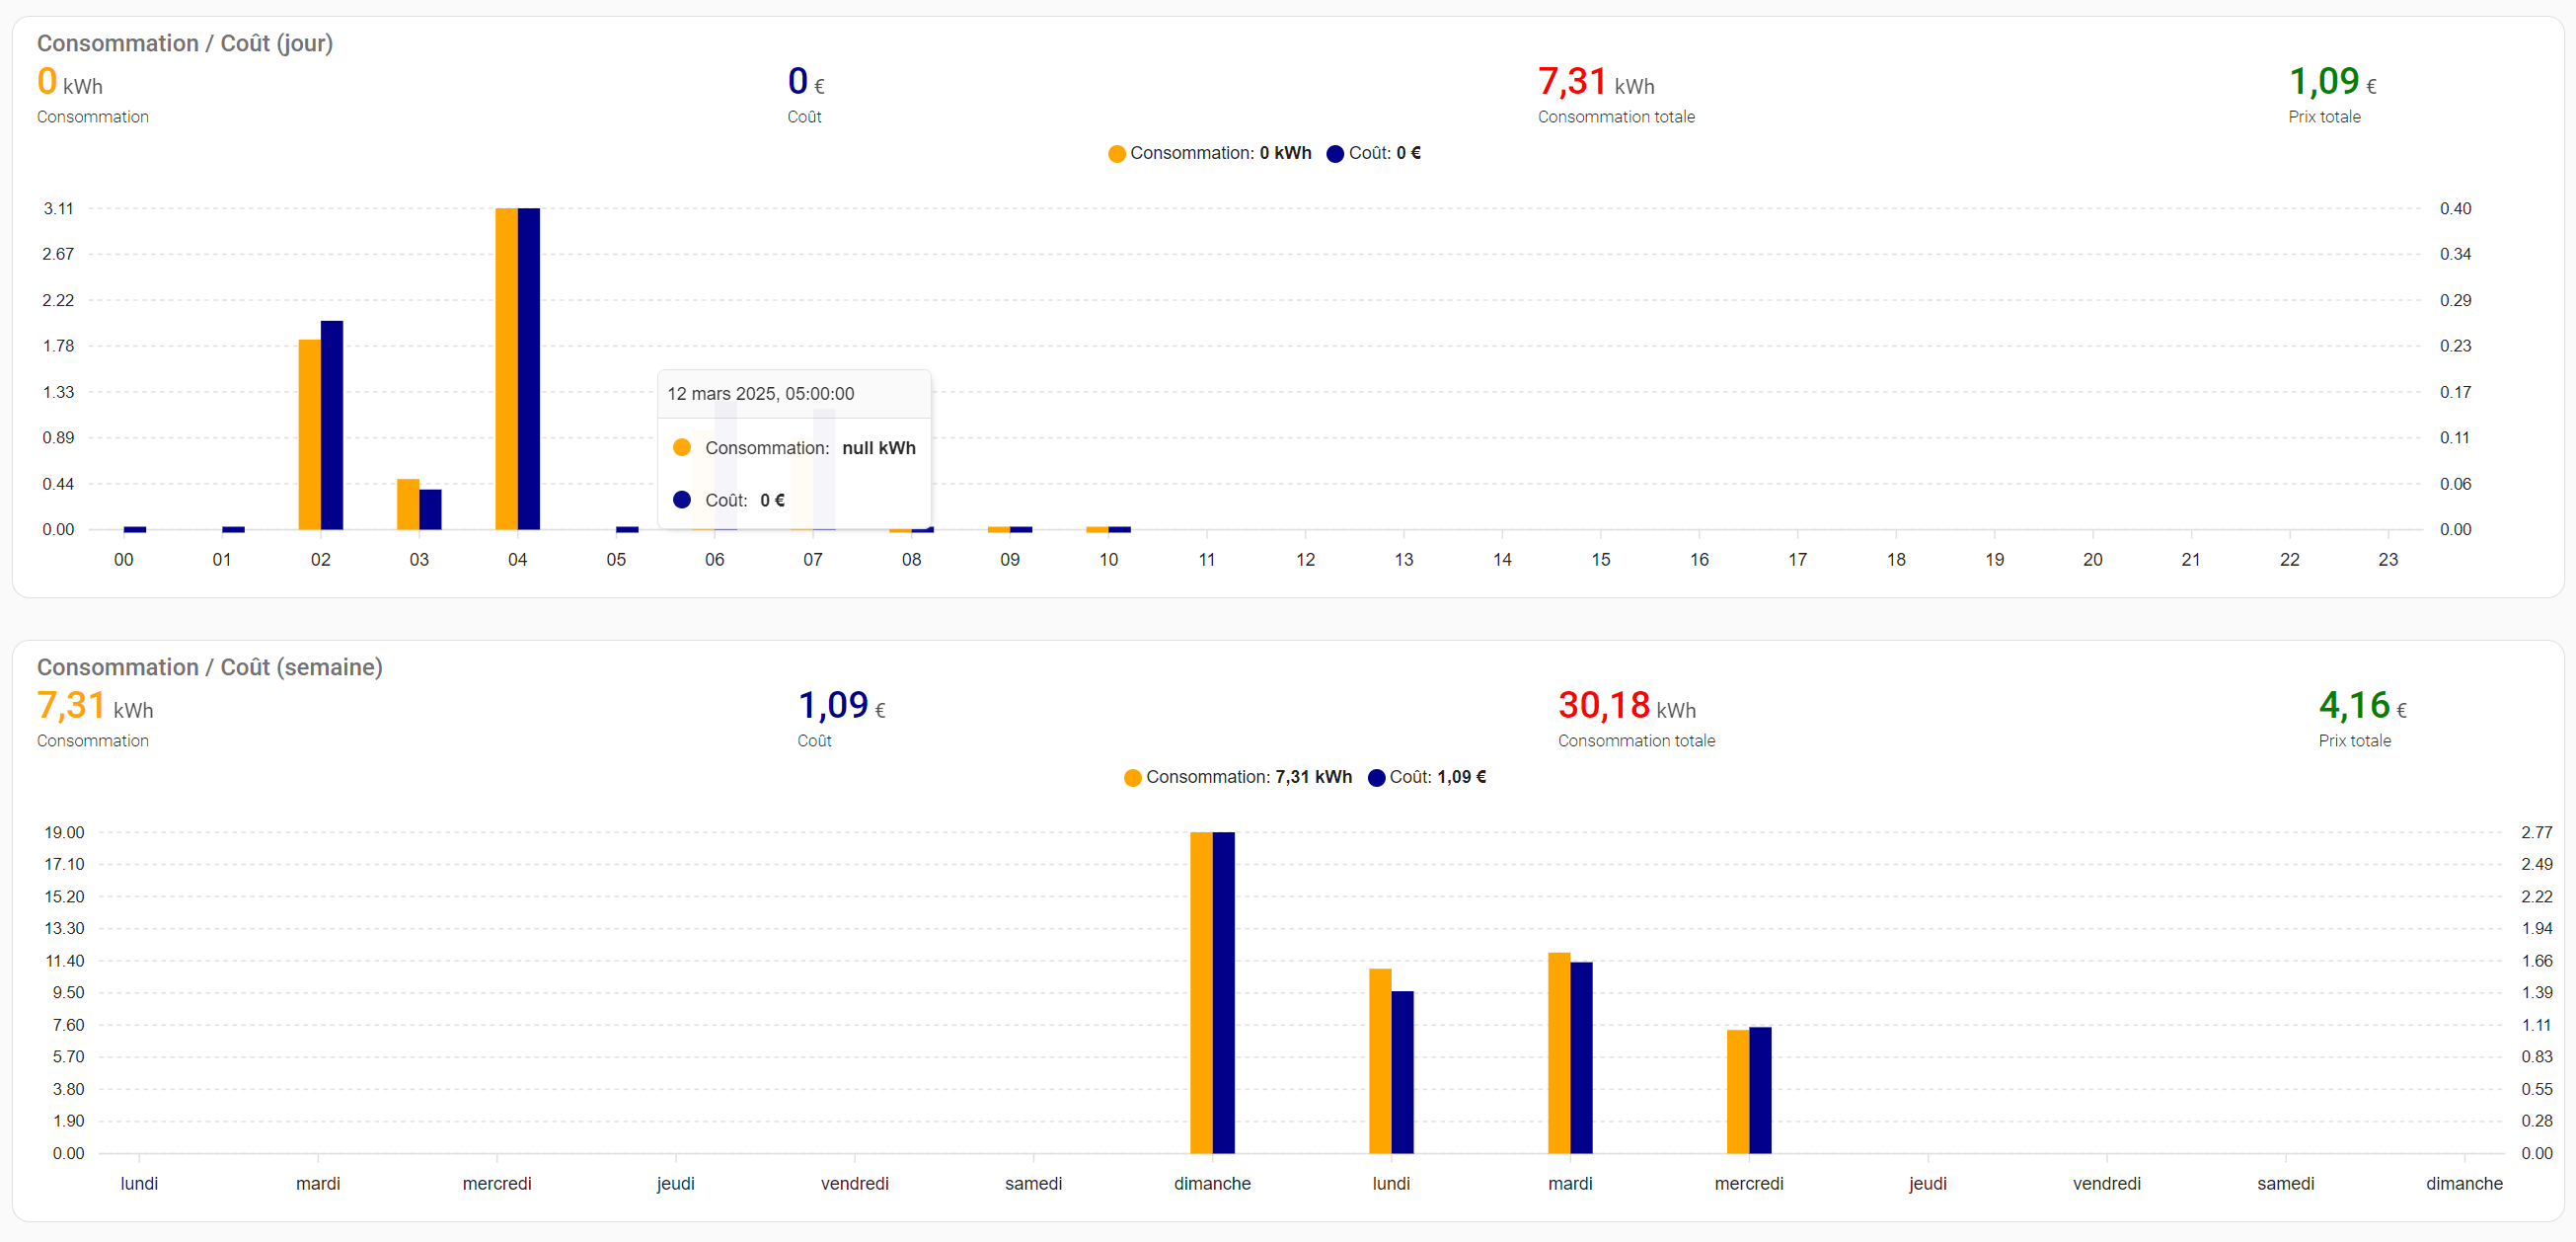
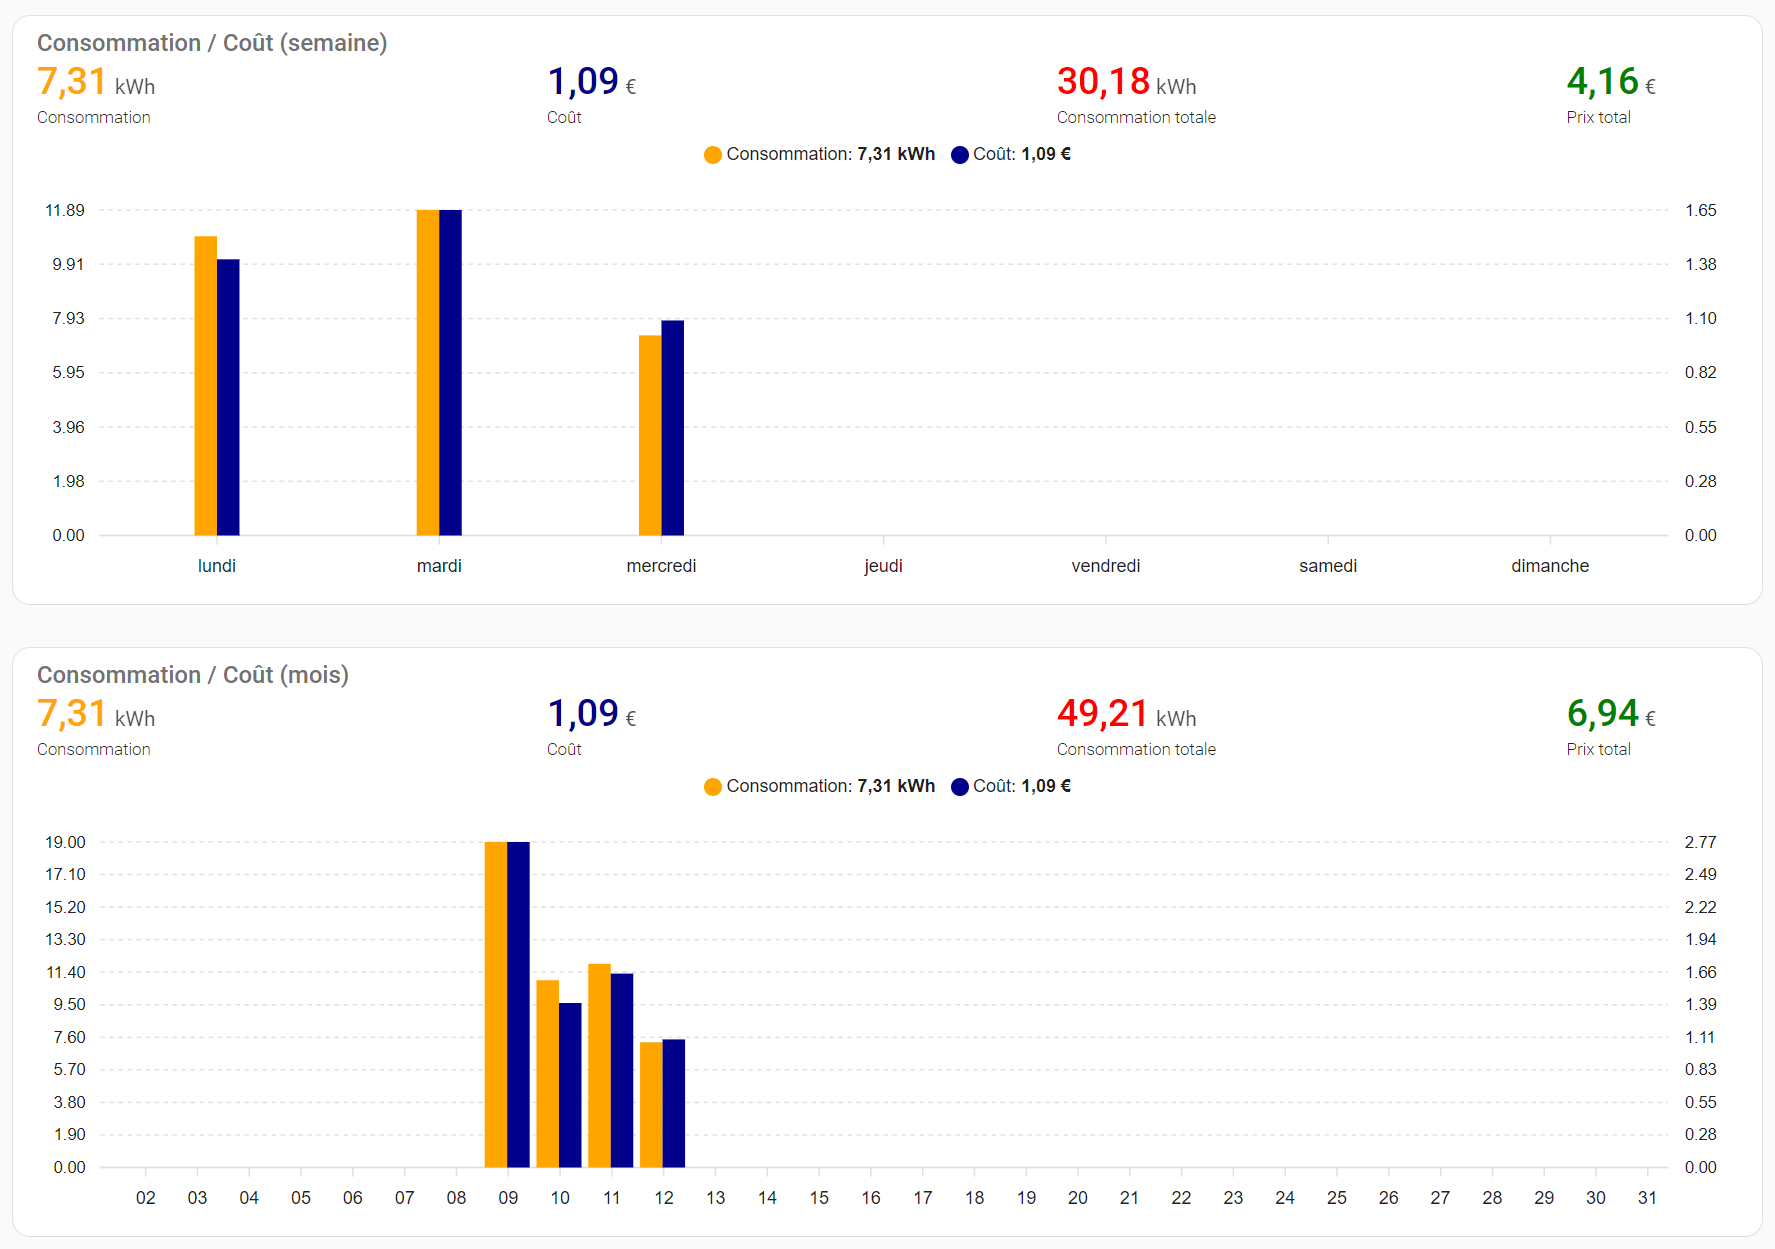
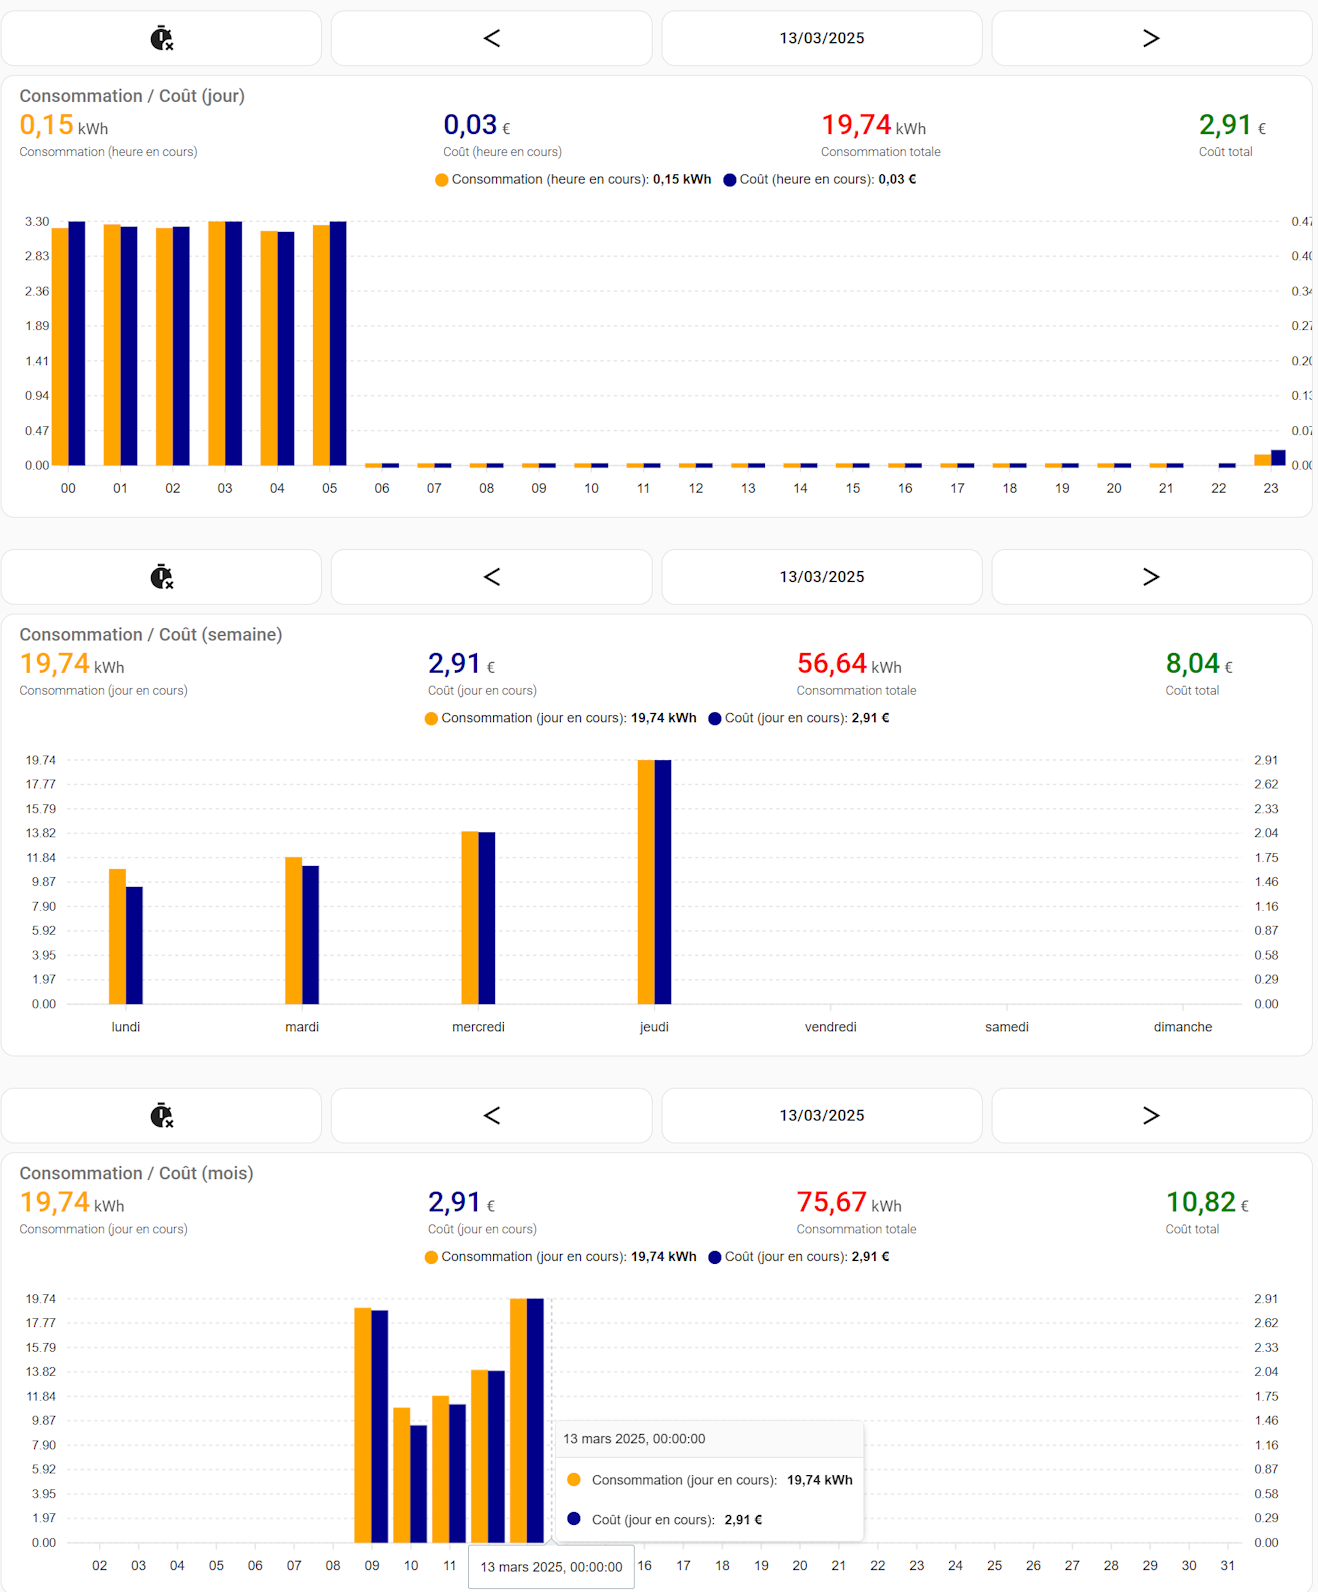
Pire encore, si on utilise les 3 graphes (jour / semaine / mois) on voit les incohérences suivantes (il semblerait qu’il y ai un décalage de une heure, problème UTC ?) :
OK : Entre le jour et la semaine, on peut voir que le coût total de la journée en cours (1,09€) correspond bien au coût en cours de la semaine (donc du jour en cours)
NOK : Le jour en cours est le 12, la semaine débute le lundi 10. Si je cumule les consommations / coût de chaque jour du mois en cours (10,11,12) je n’obtiens pas du tout le cumul de la semaine en cours (graphique semaine : Consommation totale / Prix totale) (tient il y a une faute d’orthographe).
NOK : Les infobulles, comme dit précédemment ne semble pas correspondre aux dates.
Code entier de la vue
path: consommation-green-up
title: Consommation Green'Up
icon: mdi:home-lightning-bolt
type: custom:grid-layout
cards:
  - type: custom:layout-card
    layout_type: custom:grid-layout
    layout:
      grid-template-columns: 2% 96% 2%
      grid-template-rows: auto
      grid-template-areas: |
        "left middle right"
    cards:
      - type: custom:gap-card
        view_layout:
          grid:area: left
      - type: custom:apexcharts-card
        graph_span: 1d1
        span:
          end: day
        apex_config:
          legend:
            position: top
          chart:
            height: 300px
          xaxis:
            labels:
              format: HH
          plotOptions:
            bar:
              columnWidth: 15
        yaxis:
          - id: conso
            decimals: 2
            min: ~0
            max: ~0.1
            opposite: false
          - id: cumulative_conso
            min: 0
            max: 0
            show: false
          - id: cumulative_price
            min: 0
            max: 0
            show: false
          - id: price
            decimals: 2
            opposite: true
            min: ~0
            max: ~0.1
        header:
          show: true
          title: Consommation / Coût (jour)
          show_states: true
          colorize_states: true
        series:
          - entity: sensor.consommation_de_la_greenup
            name: Consommation
            yaxis_id: conso
            stroke_width: 2
            unit: " kWh"
            float_precision: 2
            color: orange
            type: column
            group_by:
              func: diff
              duration: 1h
          - entity: sensor.cout_de_la_consommation_de_la_greenup
            name: Coût
            yaxis_id: price
            stroke_width: 2
            color: darkblue
            unit: " €"
            float_precision: 2
            type: column
            group_by:
              func: diff
              duration: 1h
          - entity: sensor.consommation_de_la_greenup
            name: Consommation totale
            yaxis_id: cumulative_conso
            unit: " kWh"
            float_precision: 2
            color: red
            group_by:
              func: diff
              duration: 1d
            show:
              in_chart: false
          - entity: sensor.cout_de_la_consommation_de_la_greenup
            name: Prix totale
            yaxis_id: cumulative_price
            unit: " €"
            float_precision: 2
            color: green
            group_by:
              func: diff
              duration: 1d
            show:
              in_chart: false
      - type: custom:gap-card
        view_layout:
          grid:area: right
  - type: custom:layout-card
    layout_type: custom:grid-layout
    layout:
      grid-template-columns: 2% 96% 2%
      grid-template-rows: auto
      grid-template-areas: |
        "left middle right"
    cards:
      - type: custom:gap-card
        view_layout:
          grid:area: left
      - type: custom:apexcharts-card
        apex_config:
          legend:
            position: top
          chart:
            height: 300px
          plotOptions:
            bar:
              columnWidth: 15
          xaxis:
            labels:
              format: dddd
        graph_span: 7d1
        span:
          end: isoWeek
        yaxis:
          - id: conso
            decimals: 2
            min: ~0
            max: ~0.1
            opposite: false
          - id: cumulative_conso
            min: 0
            max: 0
            show: false
          - id: cumulative_price
            min: 0
            max: 0
            show: false
          - id: price
            decimals: 2
            opposite: true
            min: ~0
            max: ~0.1
        header:
          show: true
          title: Consommation / Coût (semaine)
          show_states: true
          colorize_states: true
        series:
          - entity: sensor.consommation_de_la_greenup
            name: Consommation
            yaxis_id: conso
            unit: " kWh"
            float_precision: 2
            color: orange
            type: column
            group_by:
              func: diff
              duration: 1day
          - entity: sensor.cout_de_la_consommation_de_la_greenup
            name: Coût
            yaxis_id: price
            color: darkblue
            unit: " €"
            float_precision: 2
            type: column
            group_by:
              func: diff
              duration: 1day
          - entity: sensor.consommation_de_la_greenup
            name: Consommation totale
            yaxis_id: cumulativeconso
            unit: " kWh"
            float_precision: 2
            type: column
            color: red
            group_by:
              func: diff
              duration: 7day
            show:
              in_chart: false
              datalabels: false
              legend_value: false
          - entity: sensor.cout_de_la_consommation_de_la_greenup
            name: Prix totale
            yaxis_id: cumulativeprice
            unit: " €"
            float_precision: 2
            type: column
            color: green
            group_by:
              func: diff
              duration: 7day
            show:
              in_chart: false
              datalabels: false
              legend_value: false
      - type: custom:gap-card
        view_layout:
          grid:area: right
  - type: custom:layout-card
    layout_type: custom:grid-layout
    layout:
      grid-template-columns: 2% 96% 2%
      grid-template-rows: auto
      grid-template-areas: |
        "left middle right"
    cards:
      - type: custom:gap-card
        view_layout:
          grid:area: left
      - type: custom:apexcharts-card
        apex_config:
          legend:
            position: top
          chart:
            height: 300px
          xaxis:
            labels:
              format: dd
          plotOptions:
            bar:
              columnWidth: 15
        graph_span: 1month
        span:
          end: month
        yaxis:
          - id: conso
            decimals: 2
            min: ~0
            max: ~0.1
            opposite: false
          - id: cumulative_conso
            min: 0
            max: 0
            show: false
          - id: cumulative_price
            min: 0
            max: 0
            show: false
          - id: price
            decimals: 2
            opposite: true
            min: ~0
            max: ~0.1
        header:
          show: true
          title: Consommation / Coût (mois)
          show_states: true
          colorize_states: true
        series:
          - entity: sensor.consommation_de_la_greenup
            name: Consommation
            yaxis_id: conso
            unit: " kWh"
            float_precision: 2
            color: orange
            type: column
            group_by:
              func: diff
              duration: 1day
          - entity: sensor.cout_de_la_consommation_de_la_greenup
            name: Coût
            yaxis_id: price
            color: darkblue
            unit: " €"
            float_precision: 2
            type: column
            group_by:
              func: diff
              duration: 1day
          - entity: sensor.consommation_de_la_greenup
            name: Consommation totale
            yaxis_id: cumulativeconso
            unit: " kWh"
            float_precision: 2
            type: column
            color: red
            group_by:
              func: diff
              duration: 1month
            show:
              in_chart: false
              datalabels: false
              legend_value: false
          - entity: sensor.cout_de_la_consommation_de_la_greenup
            name: Prix totale
            yaxis_id: cumulativeprice
            unit: " €"
            float_precision: 2
            type: column
            color: green
            group_by:
              func: diff
              duration: 1month
            show:
              in_chart: false
              datalabels: false
              legend_value: false
      - type: custom:gap-card
        view_layout:
          grid:area: right
layout:
  layout:
    max_cols: 1
    cols: 1
    grid-template-columns: 100%
    place-content: center
En modifiant :
span:
  end: month
par :
span:
  end: month
  offset: +60m
Pour le coup, j’ai les bons calculs. Quel est cet offset ? Pourquoi il faut le mettre ?
Normalement, cet offset permet d’afficher le calcul sur la période « décalée ».
span:
  start: day
  offset: "-6d"
Dans le cas où j’utilise des graphs hebdomaires où mensuels comme toi (qui commencent donc respectivement le lundi ou le 1er du mois), je n’utilise pas le offset.
Tu as peut-être un décalage sur ton sensor qui enregistre l’intégrale sur l’heure d’après, et donc le offset paramétré à +60m corrige ce défaut.
Je pense plutôt à un problème d’heure UTC.
mercredi à 15:52 à Coordinated Universal Time correspond à16:52 dans le fuseau horaire France (UTC+1)
J’ai installé lovelace-card-templater pour utiliser Ninja.
Et voilà le code :offset_template qui calcule l’offset entre le time UTC et le time courant.
type: custom:card-templater
entities:
  - sensor.consommation_de_la_greenup
  - sensor.cout_de_la_consommation_de_la_greenup
card:
  type: custom:apexcharts-card
  apex_config:
    legend:
      position: top
    chart:
      height: 300px
    xaxis:
      labels:
        format: dd
    plotOptions:
      bar:
        columnWidth: 15
  graph_span: 1month
  span:
    end: month
    offset_template: |
      {% set value = (now().utcoffset().seconds / 60) | int %}
      {% if value > 0 %}
      +{{ value }}m
      {% else %}
      {{ value }}m
      {% endif %}
  all_series_config:
    extend_to: now
  stacked: false
  yaxis:
    - id: conso
      decimals: 2
      min: ~0
      max: ~0.1
      opposite: false
    - id: cumulative_conso
      min: 0
      max: 0
      show: false
    - id: cumulative_price
      min: 0
      max: 0
      show: false
    - id: price
      decimals: 2
      opposite: true
      min: ~0
      max: ~0.1
  header:
    show: true
    title: Consommation / Coût (mois)
    show_states: true
    colorize_states: true
  series:
    - entity: sensor.consommation_de_la_greenup
      name: Consommation
      yaxis_id: conso
      unit: " kWh"
      float_precision: 2
      color: orange
      type: column
      group_by:
        func: diff
        duration: 1day
    - entity: sensor.cout_de_la_consommation_de_la_greenup
      name: Coût
      yaxis_id: price
      color: darkblue
      unit: " €"
      float_precision: 2
      type: column
      group_by:
        func: diff
        duration: 1day
    - entity: sensor.consommation_de_la_greenup
      name: Consommation totale
      yaxis_id: cumulativeconso
      unit: " kWh"
      float_precision: 2
      type: column
      color: red
      group_by:
        func: diff
        duration: 1month
      show:
        in_chart: false
        datalabels: false
        legend_value: false
    - entity: sensor.cout_de_la_consommation_de_la_greenup
      name: Prix total
      yaxis_id: cumulativeprice
      unit: " €"
      float_precision: 2
      type: column
      color: green
      group_by:
        func: diff
        duration: 1month
      show:
        in_chart: false
        datalabels: false
        legend_value: false
Non je ne pense pas, j’ai plusieurs graphes (jour (/heure) / /semaine (/jour) / mois (/jours) et les autres sont cohérents. Ce décalage serait partout si c’était un problème de capteur.
Bon, j’ai des trucs chouettes à vous montrer.
Le but, c’est de calculer le delta en minute (+ 1h) entre deux dates séparées d’un mois.
{% set valMonth = -4 | int %}
{% set valueDecalUTC = (now().utcoffset().seconds / 60) | int %}
{% if valMonth | int == 0 %}
  {% if valueDecalUTC > 0 %}+{{ valueDecalUTC }}m{% else %}-{{ valueDecalUTC }}m{% endif %}
{% else %}
  {% if valMonth | int >= 0 %}+{% endif %}
  {% set cur_date = now() %}
>> before = {{ cur_date.day }} / {{ cur_date.month }} / {{ cur_date.year }}
  {% set str_date = (cur_date.year + ((cur_date.month + valMonth) / 12) | int) | string + '-' + ((cur_date.month + valMonth - 1) % 12 + 1) | string + '-' + cur_date.day | string %}
>> str_date = {{str_date}}
  {% set cur_date = strptime(str_date, '%Y-%m-%d') %}
>> after = {{ cur_date.day }} / {{ cur_date.month }} / {{ cur_date.year }}
J’ai encore du mal a décaler les années mais pour les mois c’est bon.
Voici les 3 graphes pour le moment :
Et le code :
path: consommation-green-up
title: Consommation Green'Up
icon: mdi:home-lightning-bolt
type: custom:grid-layout
cards:
- type: custom:layout-card
layout_type: custom:grid-layout
layout:
grid-template-columns: 2% 96% 2%
grid-template-rows: auto
grid-template-areas: |
"left middle right"
cards:
- type: custom:gap-card
view_layout:
grid:area: left
- type: vertical-stack
cards:
- type: horizontal-stack
cards:
- show_name: false
show_icon: true
type: custom:button-card
entity: input_number.greenup_graph_day_offset
show_state: false
size: 1.5em
tap_action:
action: perform-action
perform_action: counter.reset
target:
entity_id: counter.greenup_graph_day_offset_value
data: {}
hold_action:
action: none
icon: mdi:timer-remove
triggers_update: all
- show_name: false
show_icon: true
type: custom:button-card
entity: input_number.greenup_graph_day_offset
show_state: false
size: 1.5em
tap_action:
action: perform-action
perform_action: counter.decrement
target:
entity_id: counter.greenup_graph_day_offset_value
data: {}
hold_action:
action: none
icon: mdi:less-than
triggers_update: all
- type: custom:mushroom-template-card
primary: >-
{% set offset_val =
states('counter.greenup_graph_day_offset_value') | int(0) %}
{% set offset = now() + timedelta( days = offset_val, hours =
0, minutes = 00 ) %} {{
as_datetime(offset).strftime('%d/%m/%Y')
}}
secondary: ""
multiline_secondary: false
tap_action:
action: none
hold_action:
action: none
double_tap_action:
action: none
layout: vertical
fill_container: true
- show_name: false
show_icon: true
type: custom:button-card
entity: input_number.greenup_graph_day_offset
show_state: false
size: 1.5em
tap_action:
action: perform-action
perform_action: counter.increment
target:
entity_id: counter.greenup_graph_day_offset_value
data: {}
hold_action:
action: none
icon: mdi:greater-than
triggers_update: all
- type: custom:card-templater
entities:
- counter.greenup_graph_day_offset_value
- sensor.consommation_de_la_greenup
- sensor.cout_de_la_consommation_de_la_greenup
card:
type: custom:apexcharts-card
graph_span: 1d1
span:
end: day
offset_template: >
{% if states['counter.greenup_graph_day_offset_value'].state |
int == 0 %}{% else %}{% if
states['counter.greenup_graph_day_offset_value'].state | int
>= 0 %}+{% endif %}{{
states['counter.greenup_graph_day_offset_value'].state | int
}}d{% endif %}
apex_config:
legend:
position: top
chart:
height: 300px
xaxis:
labels:
format: HH
plotOptions:
bar:
columnWidth: 15
yaxis:
- id: conso
decimals: 2
min: ~0
max: ~0.1
opposite: false
- id: cumulative_conso
min: 0
max: 0
show: false
- id: cumulative_price
min: 0
max: 0
show: false
- id: price
decimals: 2
opposite: true
min: ~0
max: ~0.1
header:
show: true
title: Consommation / Coût (jour)
show_states: true
colorize_states: true
series:
- entity: sensor.consommation_de_la_greenup
name: Consommation (heure en cours)
yaxis_id: conso
stroke_width: 2
unit: " kWh"
float_precision: 2
color: orange
type: column
group_by:
func: diff
duration: 1h
- entity: sensor.cout_de_la_consommation_de_la_greenup
name: Coût (heure en cours)
yaxis_id: price
stroke_width: 2
color: darkblue
unit: " €"
float_precision: 2
type: column
group_by:
func: diff
duration: 1h
- entity: sensor.consommation_de_la_greenup
name: Consommation totale
yaxis_id: cumulative_conso
unit: " kWh"
float_precision: 2
color: red
group_by:
func: diff
duration: 1d
show:
in_chart: false
- entity: sensor.cout_de_la_consommation_de_la_greenup
name: Coût total
yaxis_id: cumulative_price
unit: " €"
float_precision: 2
color: green
group_by:
func: diff
duration: 1d
show:
in_chart: false
- type: custom:gap-card
view_layout:
grid:area: right
- type: custom:layout-card
layout_type: custom:grid-layout
layout:
grid-template-columns: 2% 96% 2%
grid-template-rows: auto
grid-template-areas: |
"left middle right"
cards:
- type: custom:gap-card
view_layout:
grid:area: left
- type: vertical-stack
cards:
- type: horizontal-stack
cards:
- show_name: false
show_icon: true
type: custom:button-card
entity: input_number.greenup_graph_week_offset
show_state: false
size: 1.5em
tap_action:
action: perform-action
perform_action: counter.reset
target:
entity_id: counter.greenup_graph_week_offset_value
data: {}
hold_action:
action: none
icon: mdi:timer-remove
triggers_update: all
- show_name: false
show_icon: true
type: custom:button-card
entity: input_number.greenup_graph_week_offset
show_state: false
size: 1.5em
tap_action:
action: perform-action
perform_action: counter.decrement
target:
entity_id: counter.greenup_graph_week_offset_value
data: {}
hold_action:
action: none
icon: mdi:less-than
triggers_update: all
- type: custom:mushroom-template-card
primary: >-
{% set offset_val =
states('counter.greenup_graph_week_offset_value') | int(0)
%} {% set offset = now() + timedelta( days = 7 * offset_val,
hours = 0, minutes = 00 ) %} {{
as_datetime(offset).strftime('%d/%m/%Y')
}}
secondary: ""
multiline_secondary: false
tap_action:
action: none
hold_action:
action: none
double_tap_action:
action: none
layout: vertical
fill_container: true
- show_name: false
show_icon: true
type: custom:button-card
entity: input_number.greenup_graph_week_offset
show_state: false
size: 1.5em
tap_action:
action: perform-action
perform_action: counter.increment
target:
entity_id: counter.greenup_graph_week_offset_value
data: {}
hold_action:
action: none
icon: mdi:greater-than
triggers_update: all
- type: custom:card-templater
entities:
- counter.greenup_graph_week_offset_value
- sensor.consommation_de_la_greenup
- sensor.cout_de_la_consommation_de_la_greenup
card:
type: custom:apexcharts-card
apex_config:
legend:
position: top
chart:
height: 300px
plotOptions:
bar:
columnWidth: 15
xaxis:
labels:
format: dddd
graph_span: 7d1
span:
end: isoWeek
offset_template: >
{% if states['counter.greenup_graph_week_offset_value'].state
| int == 0 %}{% else %}{% if
states['counter.greenup_graph_week_offset_value'].state | int
>= 0 %}+{% endif %}{{ 7 *
states['counter.greenup_graph_week_offset_value'].state | int
}}d{% endif %}
yaxis:
- id: conso
decimals: 2
min: ~0
max: ~0.1
opposite: false
- id: cumulative_conso
min: 0
max: 0
show: false
- id: cumulative_price
min: 0
max: 0
show: false
- id: price
decimals: 2
opposite: true
min: ~0
max: ~0.1
header:
show: true
title: Consommation / Coût (semaine)
show_states: true
colorize_states: true
series:
- entity: sensor.consommation_de_la_greenup
name: Consommation (jour en cours)
yaxis_id: conso
unit: " kWh"
float_precision: 2
color: orange
type: column
group_by:
func: diff
duration: 1day
- entity: sensor.cout_de_la_consommation_de_la_greenup
name: Coût (jour en cours)
yaxis_id: price
color: darkblue
unit: " €"
float_precision: 2
type: column
group_by:
func: diff
duration: 1day
- entity: sensor.consommation_de_la_greenup
name: Consommation totale
yaxis_id: cumulativeconso
unit: " kWh"
float_precision: 2
type: column
color: red
group_by:
func: diff
duration: 7day
show:
in_chart: false
datalabels: false
legend_value: false
- entity: sensor.cout_de_la_consommation_de_la_greenup
name: Coût total
yaxis_id: cumulativeprice
unit: " €"
float_precision: 2
type: column
color: green
group_by:
func: diff
duration: 7day
show:
in_chart: false
datalabels: false
legend_value: false
- type: custom:gap-card
view_layout:
grid:area: right
- type: custom:layout-card
layout_type: custom:grid-layout
layout:
grid-template-columns: 2% 96% 2%
grid-template-rows: auto
grid-template-areas: |
"left middle right"
cards:
- type: custom:gap-card
view_layout:
grid:area: left
- type: vertical-stack
cards:
- type: horizontal-stack
cards:
- show_name: false
show_icon: true
type: custom:button-card
entity: input_number.greenup_graph_month_offset
show_state: false
size: 1.5em
tap_action:
action: perform-action
perform_action: counter.reset
target:
entity_id: counter.greenup_graph_month_offset_value
data: {}
hold_action:
action: none
icon: mdi:timer-remove
triggers_update: all
- show_name: false
show_icon: true
type: custom:button-card
entity: input_number.greenup_graph_month_offset
show_state: false
size: 1.5em
tap_action:
action: perform-action
perform_action: counter.decrement
target:
entity_id: counter.greenup_graph_month_offset_value
data: {}
hold_action:
action: none
icon: mdi:less-than
triggers_update: all
- type: custom:mushroom-template-card
primary: >
{% set offset_val =
states('counter.greenup_graph_month_offset_value') | int(0)
%}
{% set cur_date = now() %}
{% set str_date = (cur_date.year + (cur_date.month +
offset_val - 1) // 12 | int) | string + '-' + ((cur_date.month
+ offset_val - 1) % 12 + 1) | string + '-' + cur_date.day |
string %} {% set cur_date = strptime(str_date, '%Y-%m-%d') %}
{{ as_datetime(cur_date).strftime('%d/%m/%Y') }}
secondary: ""
multiline_secondary: false
tap_action:
action: none
hold_action:
action: none
double_tap_action:
action: none
layout: vertical
fill_container: true
- show_name: false
show_icon: true
type: custom:button-card
entity: input_number.greenup_graph_month_offset
show_state: false
size: 1.5em
tap_action:
action: perform-action
perform_action: counter.increment
target:
entity_id: counter.greenup_graph_month_offset_value
data: {}
hold_action:
action: none
icon: mdi:greater-than
triggers_update: all
- type: custom:card-templater
entities:
- counter.greenup_graph_month_offset_value
- sensor.consommation_de_la_greenup
- sensor.cout_de_la_consommation_de_la_greenup
card:
type: custom:apexcharts-card
apex_config:
legend:
position: top
chart:
height: 300px
xaxis:
labels:
format: dd
plotOptions:
bar:
columnWidth: 15
graph_span: 1month
span:
end: month
offset_template: >
{% set valueDecalUTC = (now().utcoffset().seconds / 60) | int
%}
{% if states['counter.greenup_graph_month_offset_value'].state
| int == 0 %}
{% if valueDecalUTC > 0 %}+{{ valueDecalUTC }}m{% else %}-{{
valueDecalUTC }}m{% endif %}
{% else %}
{% if states['counter.greenup_graph_month_offset_value'].state
| int >= 0 %}+{% endif %}
{% set offset_val =
states['counter.greenup_graph_month_offset_value'].state |
int(0) %}
{% set cur_date = now() %}
{% set str_date = (cur_date.year + (cur_date.month +
offset_val - 1) // 12 | int) | string + '-' + ((cur_date.month
+ offset_val - 1) % 12 + 1) | string + '-' + cur_date.day |
string %}
{% set new_date = strptime(str_date + ' ' +
cur_date.strftime('%H:%M:%S'), '%Y-%m-%d %H:%M:%S') %} {{
((as_timestamp(new_date) - as_timestamp(cur_date)) / 60 +
valueDecalUTC) | round(0) }}m {% endif %}
all_series_config:
extend_to: now
stacked: false
yaxis:
- id: conso
decimals: 2
min: ~0
max: ~0.1
opposite: false
- id: cumulative_conso
min: 0
max: 0
show: false
- id: cumulative_price
min: 0
max: 0
show: false
- id: price
decimals: 2
opposite: true
min: ~0
max: ~0.1
header:
show: true
title: Consommation / Coût (mois)
show_states: true
colorize_states: true
series:
- entity: sensor.consommation_de_la_greenup
name: Consommation (jour en cours)
yaxis_id: conso
unit: " kWh"
float_precision: 2
color: orange
type: column
group_by:
func: diff
duration: 1day
- entity: sensor.cout_de_la_consommation_de_la_greenup
name: Coût (jour en cours)
yaxis_id: price
color: darkblue
unit: " €"
float_precision: 2
type: column
group_by:
func: diff
duration: 1day
- entity: sensor.consommation_de_la_greenup
name: Consommation totale
yaxis_id: cumulativeconso
unit: " kWh"
float_precision: 2
type: column
color: red
group_by:
func: diff
duration: 1month
show:
in_chart: false
datalabels: false
legend_value: false
- entity: sensor.cout_de_la_consommation_de_la_greenup
name: Coût total
yaxis_id: cumulativeprice
unit: " €"
float_precision: 2
type: column
color: green
group_by:
func: diff
duration: 1month
show:
in_chart: false
datalabels: false
legend_value: false
- type: custom:gap-card
view_layout:
grid:area: right
layout:
layout:
max_cols: 1
cols: 1
grid-template-columns: 100%
place-content: center
Et la vue pour l’année :
type: custom:layout-card
layout_type: custom:grid-layout
layout:
  grid-template-columns: 2% 96% 2%
  grid-template-rows: auto
  grid-template-areas: |
    "left middle right"
cards:
  - type: custom:gap-card
    view_layout:
      grid:area: left
  - type: vertical-stack
    cards:
      - type: horizontal-stack
        cards:
          - show_name: false
            show_icon: true
            type: custom:button-card
            entity: input_number.greenup_graph_year_offset
            show_state: false
            size: 1.5em
            tap_action:
              action: perform-action
              perform_action: counter.reset
              target:
                entity_id: counter.greenup_graph_year_offset_value
              data: {}
            hold_action:
              action: none
            icon: mdi:timer-remove
            triggers_update: all
          - show_name: false
            show_icon: true
            type: custom:button-card
            entity: input_number.greenup_graph_year_offset
            show_state: false
            size: 1.5em
            tap_action:
              action: perform-action
              perform_action: counter.decrement
              target:
                entity_id: counter.greenup_graph_year_offset_value
              data: {}
            hold_action:
              action: none
            icon: mdi:less-than
            triggers_update: all
          - type: custom:mushroom-template-card
            primary: >
              {% set offset_val =
              states('counter.greenup_graph_year_offset_value') | int(0)  %} {%
              set cur_date = now() %} {% set str_date = (cur_date.year +
              offset_val) | string + '-' + cur_date.month | string + '-' +
              cur_date.day | string %} {% set cur_date = strptime(str_date,
              '%Y-%m-%d') %} {{ as_datetime(cur_date).strftime('%d/%m/%Y') }}
            secondary: ""
            multiline_secondary: false
            tap_action:
              action: none
            hold_action:
              action: none
            double_tap_action:
              action: none
            layout: vertical
            fill_container: true
          - show_name: false
            show_icon: true
            type: custom:button-card
            entity: input_number.greenup_graph_year_offset
            show_state: false
            size: 1.5em
            tap_action:
              action: perform-action
              perform_action: counter.increment
              target:
                entity_id: counter.greenup_graph_year_offset_value
              data: {}
            hold_action:
              action: none
            icon: mdi:greater-than
            triggers_update: all
      - type: custom:card-templater
        entities:
          - counter.greenup_graph_year_offset_value
          - sensor.consommation_de_la_greenup
          - sensor.cout_de_la_consommation_de_la_greenup
        card:
          type: custom:apexcharts-card
          apex_config:
            legend:
              position: top
            chart:
              height: 300px
            xaxis:
              labels:
                format: MMM
            plotOptions:
              bar:
                columnWidth: 15
          graph_span: 1year
          span:
            end: year
            offset_template: >
              {% if states['counter.greenup_graph_year_offset_value'].state |
              int == 0 %}{% else %}{% if
              states['counter.greenup_graph_year_offset_value'].state | int >= 0
              %}+{% endif %}{{
              states['counter.greenup_graph_year_offset_value'].state | int
              }}year{% endif %}
          stacked: false
          yaxis:
            - id: conso
              decimals: 2
              min: ~0
              max: ~0.1
              opposite: false
            - id: cumulative_conso
              min: 0
              max: 0
              show: false
            - id: cumulative_price
              min: 0
              max: 0
              show: false
            - id: price
              decimals: 2
              opposite: true
              min: ~0
              max: ~0.1
          header:
            show: true
            title: Consommation / Coût (année)
            show_states: true
            colorize_states: true
          series:
            - entity: sensor.consommation_de_la_greenup
              name: Consommation (mois en cours)
              yaxis_id: conso
              unit: " kWh"
              float_precision: 2
              color: orange
              type: column
              group_by:
                func: diff
                duration: 1month
            - entity: sensor.cout_de_la_consommation_de_la_greenup
              name: Coût (mois en cours)
              yaxis_id: price
              color: darkblue
              unit: " €"
              float_precision: 2
              type: column
              group_by:
                func: diff
                duration: 1month
            - entity: sensor.consommation_de_la_greenup
              name: Consommation totale
              yaxis_id: cumulativeconso
              unit: " kWh"
              float_precision: 2
              type: column
              color: red
              group_by:
                func: diff
                duration: 1year
              show:
                in_chart: false
                datalabels: false
                legend_value: false
            - entity: sensor.cout_de_la_consommation_de_la_greenup
              name: Coût total
              yaxis_id: cumulativeprice
              unit: " €"
              float_precision: 2
              type: column
              color: green
              group_by:
                func: diff
                duration: 1year
              show:
                in_chart: false
                datalabels: false
                legend_value: false
  - type: custom:gap-card
    view_layout:
      grid:area: right
Sans l’ajout de statistics (ex ci–dessous), je doute que tu puisses afficher des données sur des semaines en arrière, notamment pour le graphique avec les valeurs par mois.
    statistics:
      type: state
      period: day
      align: start
Il faudrait faire quoi ? Le mettre où ?
Brico
Juin 21, 2026, 2:05
32
bonjour , je ne sais si je suis au bon endroit, je rencontre un vrai problème avec Apexchart, dès que je programme une carte avec 2 entités sur une période très courte , mon nuc se met à ramer .
C'est un :DN2820FYK cela vient il de sa puissance ?
Merci à tous.
Avez vous le même ressenti ?
Tes deux entités se rafraîchissement à quelle fréquence ?