Je me réponds à moi même, j’ai finalement trouvé la solution :
type: custom:apexcharts-card
chart_type: donut
header:
show: true
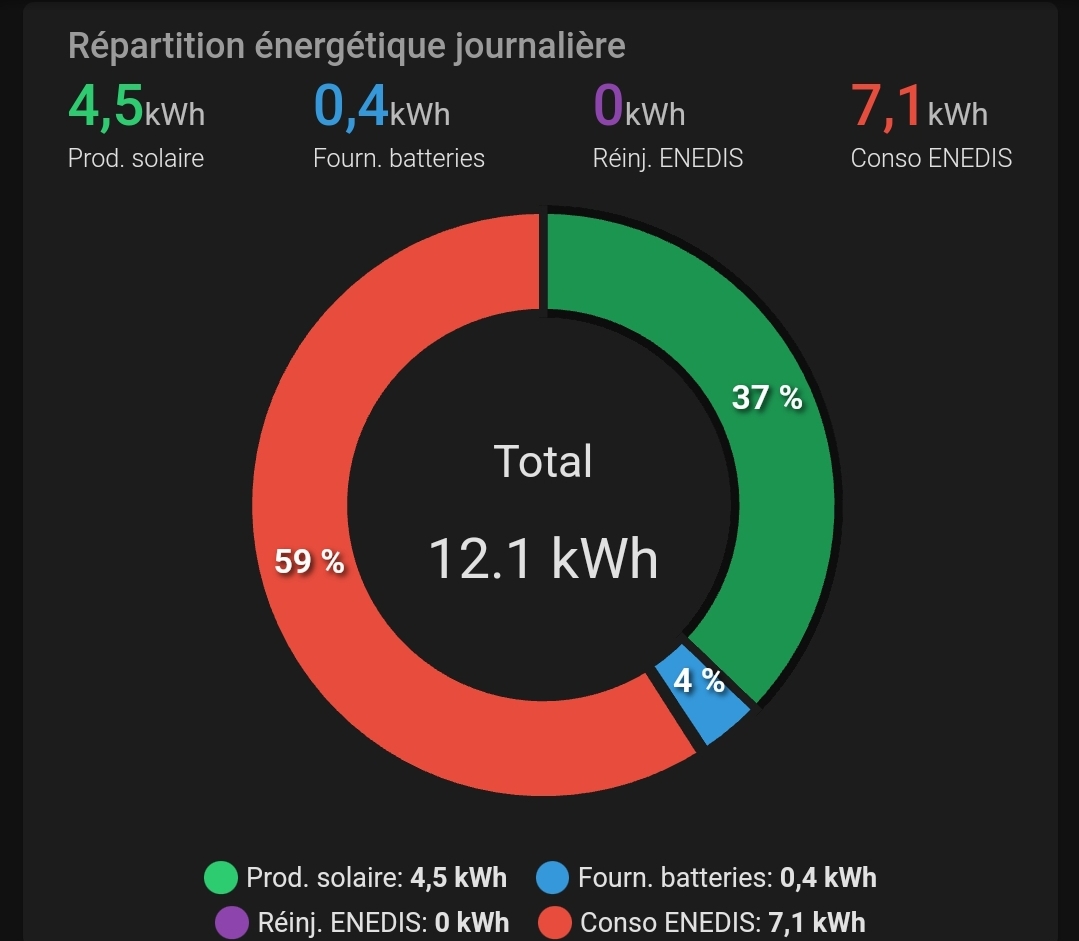
title: Répartition énergétique journalière
show_states: true
colorize_states: true
apex_config:
dataLabels:
formatter: |
EVAL:function(value) {
return value.toFixed(0) + " %";
}
plotOptions:
pie:
donut:
labels:
show: true
total:
show: true
label: Total
formatter: |
EVAL:function(w) {
return w.globals.seriesTotals.reduce((a, b) => {return (a + b)} , 0).toFixed(1) + " kWh"
}
series:
- entity: sensor.bilan_autoconso_gain_3000wc_now
name: Prod. solaire
float_precision: 1
color: '#2ECC71'
- entity: sensor.daily_lg_chem_total_energy_saved
name: Fourn. batteries
float_precision: 1
color: '#3498DB'
- entity: sensor.daily_lg_chem_simulated_grid_export_after_battery_charging
name: Réinj. ENEDIS
float_precision: 1
color: '#8E44AD'
- entity: sensor.daily_lg_chem_simulated_grid_import_after_battery_discharging
name: Conso ENEDIS
float_precision: 1
color: '#E74C3C'