Bonjour,
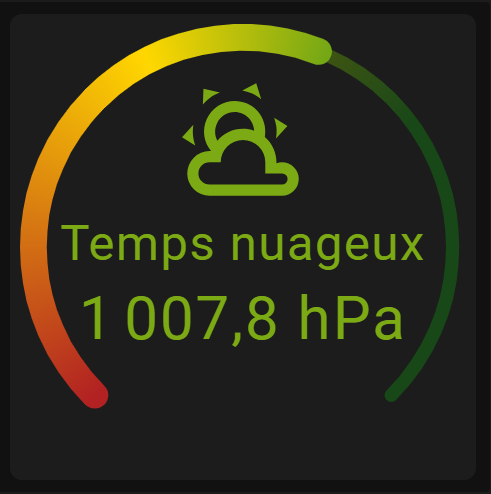
Je ne parviens pas à afficher ma horseshoe card dans bubble card. Elle est tronquée.
Comment dire que je veux une hauteur plus grande pour l’afficher complètement ou réduire la horseshoe card
Une image vaut mieux que des mots.
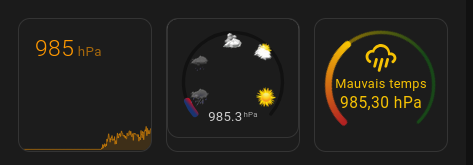
le second en bas était pour tester si c’était le fait d’avoir l’horizontal qui bloquait
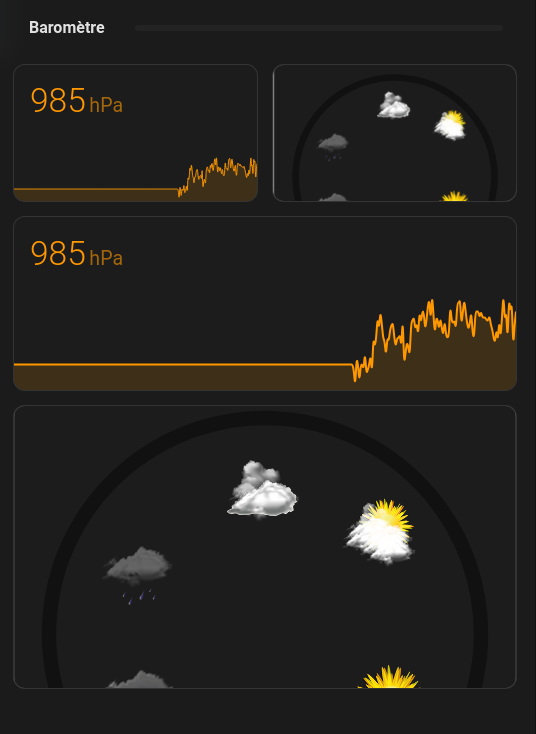
Et ci dessous le code complet de mon popup
type: vertical-stack
cards:
  - type: custom:bubble-card
    card_type: pop-up
    hash: "#Station_Ecowitt"
    button_type: name
    show_header: false
    style: |
      :host {
        --popup-min-height: auto;
        --popup-max-height: none;
        --popup-min-width: auto;
        --popup-max-width: none;
      }
      ha-card {
        max-height: none !important;
        overflow: visible !important;
      }
  - type: custom:mini-graph-card
    hours_to_show: 24
    points_per_hour: 4
    line_width: 2
    entities:
      - entity: sensor.ws2900_v2_02_03_outdoor_temperature
        name: Temperature
        show_state: true
        state_adaptive_color: true
      - color: "#2129cd"
        entity: sensor.ws2900_v2_02_03_humidity
        name: Humidity
        y_axis: secondary
        show_state: true
        state_adaptive_color: true
        decimals: 0
    show:
      labels: false
      labels_secondary: false
      icon: false
      state: true
      extrema: true
      points: false
      name: false
  - type: custom:bubble-card
    card_type: separator
    name: Pluie
  - type: horizontal-stack
    cards:
      - type: custom:mini-graph-card
        name: Pluie
        hours_to_show: 48
        points_per_hour: 4
        decimals: 1
        font_size: 68
        entities:
          - entity: sensor.ws2900_v2_02_03_rain_rate
            name: Rain
            show_state: false
            state_adaptive_color: true
          - entity: sensor.ws2900_v2_02_03_rain_rate
            name: Jour
            show_state: true
            show_graph: false
            state_adaptive_color: true
        show:
          labels: false
          icon: false
          state: true
          graph: bar
          name: false
      - type: custom:rain-gauge-card
        entity: sensor.ws2900_v2_02_03_daily_rain
        hourly_rate_entity: sensor.ws2900_v2_02_03_daily_rain
        name: " "
  - type: custom:bubble-card
    card_type: separator
    name: Baromètre
  - type: horizontal-stack
    cards:
      - type: custom:mini-graph-card
        hours_to_show: 24
        points_per_hour: 15
        line_width: 2
        decimals: 0
        entities:
          - entity: sensor.ws2900_v2_02_03_relative_pressure
            show_state: true
            state_adaptive_color: true
        show:
          labels: false
          icon: false
          state: true
          points: false
          name: false
      - type: picture-elements
        image: /local/blank1.png
        style:
          height: 1000px
        elements:
          - type: custom:flex-horseshoe-card
            entities:
              - entity: sensor.ws2900_v2_02_03_relative_pressure
                decimals: 1
                name: Barometer
                attributes: pressure
            show:
              horseshoe_style: lineargradient
            layout:
              states:
                - id: 0
                  entity_index: 0
                  xpos: 50
                  ypos: 85
                  styles:
                    - font-size: 2em;
                    - opacity: 0.9;
            horseshoe_scale:
              min: 980
              max: 1060
            color_stops:
              "970": "#193471"
              "1020": "#999ab8"
              "1030": "#f7ff00"
              "1060": "#ff0000"
            style:
              top: 79%
              left: 50%
              width: 100%
              style: |
                ha-card {
                  box-shadow: none;
                }
          - type: image
            image: /local/Images/Weather/sunny.png
            style:
              top: 105%
              left: 75%
              width: 15%
          - type: image
            image: /local/Images/Weather/overcast.png
            style:
              top: 45%
              left: 73%
              width: 15%
          - type: image
            image: /local/Images/Weather/cloudy.png
            style:
              top: 30%
              left: 50%
              width: 15%
          - type: image
            image: /local/Images/Weather/rain.png
            style:
              top: 60%
              left: 25%
              width: 15%
          - type: image
            image: /local/Images/Weather/storm.png
            style:
              top: 105%
              left: 25%
              width: 15%
  - type: picture-elements
    image: /local/blank1.png
    elements:
      - type: custom:flex-horseshoe-card
        entities:
          - entity: sensor.ws2900_v2_02_03_relative_pressure
            decimals: 1
            name: Barometer
            attributes: pressure
        show:
          horseshoe_style: lineargradient
        layout:
          states:
            - id: 0
              entity_index: 0
              xpos: 50
              ypos: 85
              styles:
                - font-size: 2em;
                - opacity: 0.9;
        horseshoe_scale:
          min: 980
          max: 1060
        color_stops:
          "970": "#193471"
          "1020": "#999ab8"
          "1030": "#f7ff00"
          "1060": "#ff0000"
        style:
          top: 79%
          left: 50%
          width: 100%
          transform: translate(-50%, -50%)
      - type: image
        image: /local/Images/Weather/sunny.png
        style:
          top: 105%
          left: 75%
          width: 15%
      - type: image
        image: /local/Images/Weather/overcast.png
        style:
          top: 60%
          left: 75%
          width: 15%
      - type: image
        image: /local/Images/Weather/cloudy.png
        style:
          top: 30%
          left: 50%
          width: 15%
      - type: image
        image: /local/Images/Weather/rain.png
        style:
          top: 60%
          left: 25%
          width: 15%
      - type: image
        image: /local/Images/Weather/storm.png
        style:
          top: 105%
          left: 25%
          width: 15%
J’ai essayé d’ajouter différents choses proposer par chatgpt mais sans succès
Je n’ai pas réussi à trouver dans la doc mais si cela se trouve j’ai raté l’info
Merci