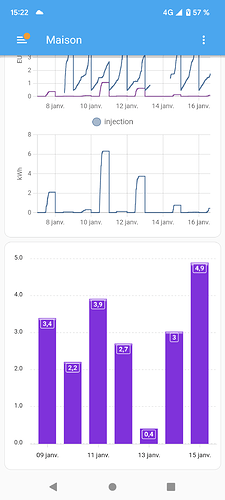
J’ai trouvé en fouillant ce forum.
Merci à @RomRider qui a aidé @Galadan
Plus qu’à modifier le code pour mon thème à moi. Voici le code actuel et le rendu
type: custom:apexcharts-card
graph_span: 7d
span:
  start: day
  offset: '-7d'
stacked: true
header:
  show: false
  title: Conso à 7 jours
apex_config:
  chart:
    type: area
    height: 400
  stroke:
    show: true
    width: 1
    curve: smooth
  legend:
    show: true
  fill:
    type: gradient
    gradient:
      shadeIntensity: 0.1
      opacityFrom: 0.25
      opacityTo: 1
      inverseColors: true
      stops:
        - 0
        - 2
        - 4
series:
  - color: rgb(138,43,226)
    entity: sensor.atome_daily_price
    type: column
    group_by:
      func: diff
      duration: 24h
    show:
      datalabels: true
