Intel NUC : system monitoring

Bonsoir,

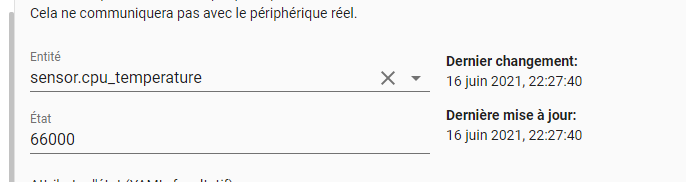
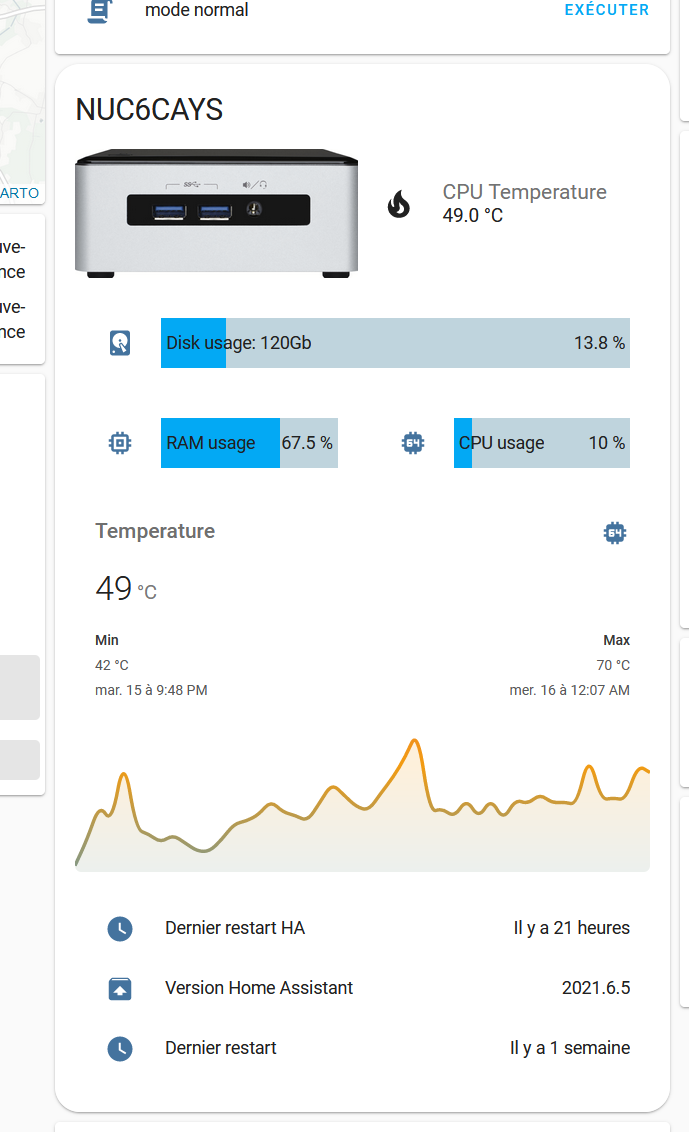
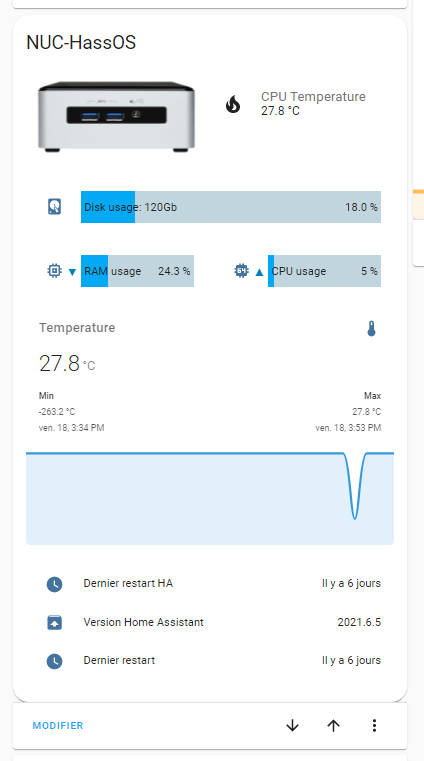
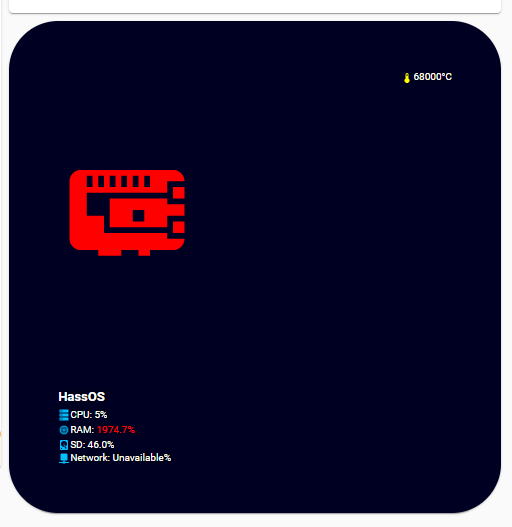
J’essais de mettre en place le monitoring de mon HassOs avec button-card, mais j’ai un soucis avec certaines valeurs comme la température et l’utilisation de la mémoire.

Qu’elle est la méthode pour avoir les bonnes valeurs ?

Je suis sur un nuc intel

type: custom:button-card
entity: sensor.cpu_temperature
icon: mdi:raspberry-pi
aspect_ratio: 2/2
name: HassOS
styles:
  card:
    - background-color: '#000022'
    - border-radius: 10%
    - padding: 10%
    - color: ivory
    - font-size: 10px
    - text-shadow: 0px 0px 5px black
    - text-transform: capitalize
  grid:
    - grid-template-areas: '"i temp" "n n" "cpu cpu" "ram ram" "sd sd" "network network" '
    - grid-template-columns: 1fr 1fr
    - grid-template-rows: 1fr min-content min-content min-content min-content
  name:
    - font-weight: bold
    - font-size: 13px
    - color: white
    - align-self: middle
    - justify-self: start
    - padding-bottom: 4px
  img_cell:
    - justify-content: start
    - align-items: start
    - margin: none
  icon:
    - color: |
        [[[
          if (entity.state < 60) return 'lime';
          if (entity.state >= 60 && entity.state < 80) return 'orange';
          else return 'red';
        ]]]
    - width: 70%
    - margin-top: '-10%'
  custom_fields:
    temp:
      - align-self: start
      - justify-self: end
    cpu:
      - padding-bottom: 2px
      - align-self: middle
      - justify-self: start
      - '--text-color-sensor': >-
          [[[ if (states["sensor.processor_use_percent"].state > 80) return
          "red"; ]]]
    ram:
      - padding-bottom: 2px
      - align-self: middle
      - justify-self: start
      - '--text-color-sensor': '[[[ if (states["sensor.memory_use"].state > 80) return "red"; ]]]'
    sd: |
    [[[
      return `<ha-icon
        icon="mdi:harddisk"
        style="width: 12px; height: 12px; color: deepskyblue;">
        </ha-icon><span>SD: <span style="color: var(--text-color-sensor);">${states['sensor.disk_use'].state}%</span></span>`
    ]]]
  network: |
    [[[
      return `<ha-icon
        icon="mdi:network"
        style="width: 12px; height: 12px; color: deepskyblue;">
        </ha-icon><span>Network: <span style="color: var(--text-color-sensor);">${states['sensor.ipv4_address_eth0'].state}%</span></span>`
    ]]]

D’avance merci


Il te faut modifier les deux sensor par le nom valable
Je t’invite dans home assistant > outils de développement afin de vérifier leurs noms

entity: sensor.cpu_temperature

Et

sensor.memory_use

Bonsoir,

C’est ce que j’ai mis

image

Le code du bouton importe peu dans la résolution de ton problème.

Comment récupères-tu la température ? Qu’elle intégration ?

Celle-ci : System Monitor - Home Assistant ?

As tu regardé ici : Nuc System Monitoring Card - #12 by liamstears - Lovelace & Frontend - Home Assistant Community pour les conversions ?

Si besoin d’aide, n’hésite pas à demander :+1:

Bonjour @Clemalex,

Effectivement, j’utilise System Monitor - Home Assistant

Je vais re-regarder Nuc System Monitoring Card - #12 by liamstears - Lovelace & Frontend - Home Assistant Community

Si besoin, je reviendrai vers toi

voila ce que j’ai
avec le code

type: entities
title: ' NUC6CAYS'
show_header_toggle: false
style: |
  ha-card { border-radius: 20px; }
entities:
  - type: custom:hui-vertical-stack-card
    cards:
      - type: horizontal-stack
        cards:
          - type: picture
            style: |
              ha-card { 
                  --paper-card-background-color: 'rgba(0, 0, 0, 0.0)';
                  --ha-card-background: "rgba(0, 0, 0, 0.0)";
                  --ha-card-box-shadow: 'none';
              }
            image: /local/image/Nuc.png
          - type: custom:button-card
            layout: icon_name_state2nd
            show_icon: true
            show_state: true
            styles:
              grid:
                - grid-template-columns: 50px auto
              icon:
                - padding: 20px 10px
                - height: 30px
                - width: 30px
              card:
                - '--ha-card-background': rgba(0, 0, 0, 0.0)
                - '--ha-card-box-shadow': none
              state:
                - padding: 0px 10px
                - justify-self: start
                - font-family: Roboto, sans-serif
                - font-size: 15px
              name:
                - padding: 0px 10px
                - justify-self: start
                - color: var(--secondary-text-color)
            entity: sensor.processor_temperature
            name: CPU Temperature
            icon: mdi:fire
      - type: custom:mini-graph-card
        entities:
          - entity: sensor.cpu_speed
        name: CPU Usage
        height: 50
        line_width: 2
        font_size: 80
        hours_to_show: 4
        points_per_hour: 90
        show:
          icon: false
          extrema: true
        color_thresholds:
          - value: 28
            color: '#e74c3c'
          - value: 15
            color: '#1db954'
          - value: 0
            color: '#3498db'
        style: |
          ha-card { 
              --paper-card-background-color: 'rgba(0, 0, 0, 0.0)';
              --ha-card-background: "rgba(0, 0, 0, 0.0)";
              --ha-card-box-shadow: 'none';
          }
      - type: custom:bar-card
        title_position: inside
        name: 'Disk usage: 120Gb'
        show_icon: true
        align: split
        columns: 1
        max: 100
        unit_of_measurement: '%'
        severity:
          - value: 50
            color: '#3498db'
          - value: 75
            color: '#f39c12'
          - value: 100
            color: '#e45e65'
        style: |
          ha-card { 
            --paper-card-background-color: 'rgba(0, 0, 0, 0.0)';
            --ha-card-background: "rgba(0, 0, 0, 0.0)";
            --ha-card-box-shadow: 'none';
          }
        entity: sensor.disk_use_percent_config
      - type: horizontal-stack
        cards:
          - type: custom:bar-card
            title_position: inside
            show_icon: true
            align: split
            columns: 1
            max: 100
            unit_of_measurement: '%'
            severity:
              - value: 50
                color: '#3498db'
              - value: 75
                color: '#f39c12'
              - value: 100
                color: '#e45e65'
            style: |
              ha-card { 
                --paper-card-background-color: 'rgba(0, 0, 0, 0.0)';
                --ha-card-background: "rgba(0, 0, 0, 0.0)";
                --ha-card-box-shadow: 'none';
              }
            entity: sensor.memory_use_percent
            name: RAM usage
          - type: custom:bar-card
            title_position: inside
            show_icon: true
            align: split
            columns: 1
            max: 100
            unit_of_measurement: '%'
            severity:
              - value: 50
                color: '#3498db'
              - value: 75
                color: '#f39c12'
              - value: 100
                color: '#e45e65'
            style: |
              ha-card { 
                --paper-card-background-color: 'rgba(0, 0, 0, 0.0)';
                --ha-card-background: "rgba(0, 0, 0, 0.0)";
                --ha-card-box-shadow: 'none';
              }
            entity: sensor.processor_use_percent
            name: CPU usage
      - type: custom:mini-graph-card
        height: 130
        line_width: 3
        font_size: 80
        hours_to_show: 48
        points_per_hour: 1
        show:
          extrema: true
          fill: true
        style: |
          ha-card { 
            --ha-card-background: "rgba(0, 0, 0, 0.0)";
            --ha-card-box-shadow: 'none';
            border-radius: 5px;
          }
        entities:
          - sensor.processor_temperature
        name: Temperature
        color_thresholds:
          - value: 40
            color: '#3498db'
          - value: 50
            color: '#f39c12'
          - value: 60
            color: '#E45E65'
      - entities:
          - entity: sensor.time_online
            name: Dernier restart HA
          - entity: sensor.current_version
            name: Version Home Assistant
          - entity: sensor.last_boot
            name: Dernier restart
        show_header_toggle: false
        type: entities
        style: |
          ha-card { 
              --paper-card-background-color: 'rgba(0, 0, 0, 0.0)';
              --ha-card-background: "rgba(0, 0, 0, 0.0)";
              --ha-card-box-shadow: 'none';
          }

2 « J'aime »

Bonsoir,

Merci pour ton retour, j’ai intégrer ton code, mais je pense que j’ai toujours un pb avec la temperature du CPU, pour cela tu as créé un sensor ?

Désolé j’ai oublié le sensor


  - platform: systemmonitor
    resources:
      - type: disk_use_percent
        arg: /config
      - type: disk_use
      - type: disk_free
      - type: memory_use_percent
      - type: memory_free
      - type: processor_use
      - type: memory_use
      - type: swap_use
      - type: swap_use_percent
      - type: swap_free
      - type: load_1m
      - type: load_5m
      - type: load_15m
#      - type: network_in 	Interface, e.g., eth0 	yes
#      - type: network_out 	Interface, e.g., eth0 	yes
#      - type: throughput_network_in 	Interface, e.g., eth0 	yes
#      - type: throughput_network_out 	Interface, e.g., eth0 	yes
#      - type: packets_in 	Interface, e.g., eth0 	yes
#      - type: packets_out 	Interface, e.g., eth0 	yes
#      - type: ipv4_address 	Interface, e.g., eth0 	yes
#      - type: ipv6_address 	Interface, e.g., eth0 	yes
      - type: processor_temperature
#      - type: process 	Binary, e.g., octave-cli 	yes
      - type: last_boot
  - platform: version
  - platform: uptime
    name: Time Online

2 « J'aime »