Hello
Pour les amateurs de mushroom card, voici ma dernière version pour myelectrical :
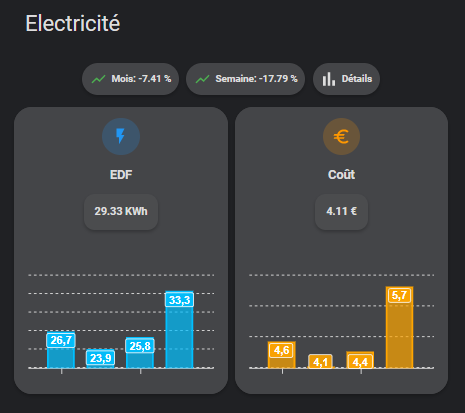
Pour la partie mushroom-template-card :
Tap_action :

Code
type: horizontal-stack
cards:
- type: custom:vertical-stack-in-card
cards:
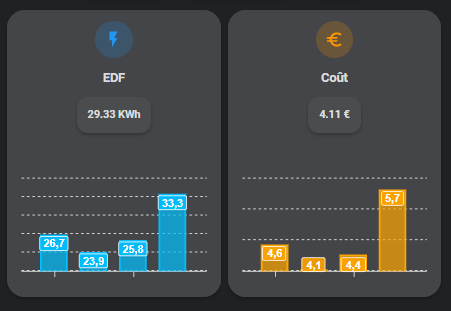
- type: custom:mushroom-template-card
primary: EDF
secondary: ''
icon: mdi:flash
entity: input_select.carburant
layout: vertical
icon_color: blue
badge_color: ''
tap_action:
action: fire-dom-event
browser_mod:
service: browser_mod.popup
data:
content:
type: custom:vertical-stack-in-card
card_mod:
style: |
ha-card {
margin-top: 0em;
}
mode: vertical
cards:
- type: custom:content-card-linky
entity: sensor.myelectricaldata_consumption_xxx
nbJoursAffichage: '7'
showPeakOffPeak: false
- type: divider
style:
height: 10px
width: 100%
margin-left: auto
margin-right: auto
background: var(--card-background-color)
- type: custom:apexcharts-card
color_list:
- deepskyblue
graph_span: 7d
span:
start: day
offset: '-7d'
header:
show: true
title: Suivi Consommation
show_states: false
series:
- entity: sensor.myelectricaldata_consumption_xxx
type: column
group_by:
duration: 1d
func: max
opacity: 0.7
stroke_width: 2
show:
datalabels: true
data_generator: >
return entity.attributes.dailyweek.map((dailyweek,
index) => {
return [new Date(dailyweek).getTime(), entity.attributes.daily[index]];
});
apex_config:
xaxis:
labels:
show: true
yaxis:
labels:
show: true
- type: custom:mushroom-chips-card
chips:
- type: template
entity: none
icon: ''
icon_color: orange
content: >-
{{ states('sensor.myelectricaldata_consumption_xxx')}}
KWh
tap_action:
action: none
card_mod:
style: |
ha-card {
--chip-border-width: 0;
alignment: center
card_mod:
style:
style: |
ha-card {
margin: -2px 0px 12px;
--chip-background: rgba(var(--rgb-disabled), 0.15);
--ha-card-box-shadow: none;
--chip-border-radius: 12px;
--chip-height: 40px;
--chip-padding: 12px;
--chip-spacing: 0px;
}
- type: custom:apexcharts-card
color_list:
- deepskyblue
graph_span: 4d
span:
start: day
offset: '-4d'
header:
show: true
show_states: false
series:
- entity: sensor.myelectricaldata_consumption_xxx
type: column
group_by:
duration: 1d
func: max
opacity: 0.7
stroke_width: 2
show:
datalabels: true
data_generator: >
return entity.attributes.dailyweek.map((dailyweek, index) =>
{
return [new Date(dailyweek).getTime(), entity.attributes.daily[index]];
});
apex_config:
xaxis:
labels:
show: false
yaxis:
labels:
show: false
card_mod:
style: |
ha-card {
box-shadow: none !important;
margin: 0px -10px;
padding: 0px 20px 0px 0px;
}
- type: custom:vertical-stack-in-card
cards:
- type: custom:mushroom-template-card
primary: Coût
secondary: ''
icon: mdi:currency-eur
layout: vertical
badge_color: ''
icon_color: orange
tap_action:
action: fire-dom-event
haptic: heavy
browser_mod:
service: browser_mod.popup
data:
size: large
content:
type: custom:vertical-stack-in-card
card_mod:
style: |
ha-card {
margin-top: 0em;
}
mode: vertical
cards:
- type: entities
title: Coûts
entities:
- entity: sensor.myelectricaldata_consumption_xxx
type: custom:multiple-entity-row
name: Semaine
show_state: false
secondary_info: null
entities:
- entity: sensor.myelectricaldata_current_week
name: En cours
- entity: sensor.myelectricaldata_last_week
name: Dernière
- entity: sensor.myelectricaldata_last_week_cost
name: Coût
- entity: sensor.myelectricaldata_consumption_xxx
type: custom:multiple-entity-row
name: Mois
show_state: false
secondary_info: null
entities:
- entity: sensor.myelectricaldata_current_month
name: En cours
- entity: sensor.myelectricaldata_last_month
name: Dernière
- entity: sensor.myelectricaldata_last_month_cost
name: Coût
- entity: sensor.myelectricaldata_consumption_xxx
type: custom:multiple-entity-row
name: Année
show_state: false
secondary_info: null
entities:
- entity: sensor.myelectricaldata_current_year
name: En cours
- entity: sensor.myelectricaldata_last_year
name: Dernière
- entity: sensor.myelectricaldata_last_year_cost
name: Coût
- entity: sensor.myelectricaldata_last_update
type: custom:multiple-entity-row
name: Mise à jour
icon: mdi:update
- type: custom:apexcharts-card
color_list:
- orange
graph_span: 7d
span:
start: day
offset: '-7d'
header:
show: true
title: Journalier
show_states: false
series:
- entity: sensor.myelectricaldata_consumption_xxx
name: Coût
type: column
unit: €
group_by:
duration: 1d
func: max
opacity: 0.7
stroke_width: 2
show:
datalabels: true
data_generator: >
return entity.attributes.dailyweek.map((dailyweek,
index) => {
return [new Date(dailyweek).getTime(), entity.attributes.dailyweek_cost[index]];
});
apex_config:
xaxis:
labels:
show: true
yaxis:
labels:
show: true
- type: custom:mushroom-chips-card
chips:
- type: template
entity: none
icon: ''
icon_color: orange
content: '{{ states("sensor.myelectricaldata_yesterday_cost") }} €'
tap_action:
action: none
card_mod:
style: |
ha-card {
--chip-border-width: 0;
alignment: center
card_mod:
style:
style: |
ha-card {
margin: -2px 0px 12px;
--chip-background: rgba(var(--rgb-disabled), 0.15);
--ha-card-box-shadow: none;
--chip-border-radius: 12px;
--chip-height: 40px;
--chip-padding: 12px;
--chip-spacing: 0px;
}
- type: custom:apexcharts-card
color_list:
- orange
graph_span: 4d
span:
start: day
offset: '-4d'
header:
show: true
show_states: false
series:
- entity: sensor.myelectricaldata_consumption_xxx
name: Coût
type: column
unit: €
group_by:
duration: 1d
func: max
opacity: 0.7
stroke_width: 2
show:
datalabels: true
data_generator: >
return entity.attributes.dailyweek.map((dailyweek, index) =>
{
return [new Date(dailyweek).getTime(), entity.attributes.dailyweek_cost[index]];
});
apex_config:
xaxis:
labels:
show: false
yaxis:
labels:
show: false
card_mod:
style: |
ha-card {
box-shadow: none !important;
margin: 0px -10px;
padding: 0px 20px 0px 0px;
}
Pour compléter, les chip card :
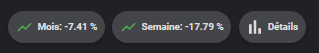
Tap_action chip card « Détails » :
Code
type: vertical-stack
cards:
- type: custom:mushroom-chips-card
chips:
- type: template
entity: sensor.myelectricaldata_current_month
icon: mdi:chart-line-variant
content: >-
{% if
'states.sensor.myelectricaldata_consumption_xxx.attributes.current_month_evolution'
== '0' %}
Mois: Pas de données
{% else %}
Mois: {{ state_attr('sensor.myelectricaldata_consumption_xxx', 'current_month_evolution') }} %
{% endif %}
icon_color: green
tap_action:
action: none
- type: template
entity: sensor.myelectricaldata_current_week
tap_action:
action: none
icon: mdi:chart-line-variant
content: >-
{% if
'states.sensor.myelectricaldata_consumption_xxx.attributes.current_week_evolution'
== '0' %}
Semaine: Pas de données
{% else %}
Semaine: {{ state_attr('sensor.myelectricaldata_consumption_xxx', 'current_week_evolution') }} %
{% endif %}
icon_color: green
- type: template
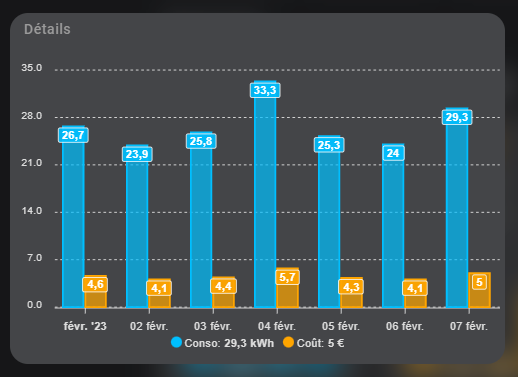
content: Détails
icon: mdi:poll
tap_action:
action: fire-dom-event
haptic: heavy
browser_mod:
service: browser_mod.popup
data:
style: |-
--popup-background-color: transperant;
--popup-border-radius: 15px;
--popup-border-color: transparent;
--popup-padding-x: 5px;
size: normal
content:
type: custom:apexcharts-card
graph_span: 7d
span:
start: day
offset: '-7d'
header:
show: true
title: Détails
show_states: false
series:
- entity: sensor.myelectricaldata_consumption_xxx
name: Conso
type: column
color: deepskyblue
group_by:
duration: 1d
func: max
opacity: 0.7
stroke_width: 2
show:
datalabels: true
data_generator: >
return entity.attributes.dailyweek.map((dailyweek, index)
=> {
return [new Date(dailyweek).getTime(), entity.attributes.daily[index]];
});
- entity: sensor.myelectricaldata_consumption_xxx
name: Coût
unit: €
color: orange
type: column
group_by:
duration: 1d
func: max
opacity: 0.7
stroke_width: 2
show:
datalabels: true
data_generator: >
return entity.attributes.dailyweek.map((dailyweek, index)
=> {
return [new Date(dailyweek).getTime(), entity.attributes.dailyweek_cost[index]];
});
apex_config:
xaxis:
labels:
show: true
yaxis:
labels:
show: true
legend:
show: true
alignment: center