Les cartes et MyelectricalData

Hello

Pour les amateurs de mushroom card, voici ma dernière version pour myelectrical :

Capture4

Pour la partie mushroom-template-card :

Capture

Tap_action :

Code
type: horizontal-stack
cards:
  - type: custom:vertical-stack-in-card
    cards:
      - type: custom:mushroom-template-card
        primary: EDF
        secondary: ''
        icon: mdi:flash
        entity: input_select.carburant
        layout: vertical
        icon_color: blue
        badge_color: ''
        tap_action:
          action: fire-dom-event
          browser_mod:
            service: browser_mod.popup
            data:
              content:
                type: custom:vertical-stack-in-card
                card_mod:
                  style: |
                    ha-card {
                      margin-top: 0em;
                        }         
                mode: vertical
                cards:
                  - type: custom:content-card-linky
                    entity: sensor.myelectricaldata_consumption_xxx
                    nbJoursAffichage: '7'
                    showPeakOffPeak: false
                  - type: divider
                    style:
                      height: 10px
                      width: 100%
                      margin-left: auto
                      margin-right: auto
                      background: var(--card-background-color)
                  - type: custom:apexcharts-card
                    color_list:
                      - deepskyblue
                    graph_span: 7d
                    span:
                      start: day
                      offset: '-7d'
                    header:
                      show: true
                      title: Suivi Consommation
                      show_states: false
                    series:
                      - entity: sensor.myelectricaldata_consumption_xxx
                        type: column
                        group_by:
                          duration: 1d
                          func: max
                        opacity: 0.7
                        stroke_width: 2
                        show:
                          datalabels: true
                        data_generator: >
                          return entity.attributes.dailyweek.map((dailyweek,
                          index) => {     
                                    return [new Date(dailyweek).getTime(), entity.attributes.daily[index]];
                                  });
                    apex_config:
                      xaxis:
                        labels:
                          show: true
                      yaxis:
                        labels:
                          show: true
      - type: custom:mushroom-chips-card
        chips:
          - type: template
            entity: none
            icon: ''
            icon_color: orange
            content: >-
              {{ states('sensor.myelectricaldata_consumption_xxx')}}
              KWh
            tap_action:
              action: none
            card_mod:
              style: |
                ha-card {
                  --chip-border-width: 0;
        alignment: center
        card_mod:
          style:
            style: |
              ha-card {
                margin: -2px 0px 12px;
                --chip-background: rgba(var(--rgb-disabled), 0.15);
                --ha-card-box-shadow: none;
                --chip-border-radius: 12px;
                --chip-height: 40px;
                --chip-padding: 12px;
                --chip-spacing: 0px;
              }
      - type: custom:apexcharts-card
        color_list:
          - deepskyblue
        graph_span: 4d
        span:
          start: day
          offset: '-4d'
        header:
          show: true
          show_states: false
        series:
          - entity: sensor.myelectricaldata_consumption_xxx
            type: column
            group_by:
              duration: 1d
              func: max
            opacity: 0.7
            stroke_width: 2
            show:
              datalabels: true
            data_generator: >
              return entity.attributes.dailyweek.map((dailyweek, index) =>
              {     
                        return [new Date(dailyweek).getTime(), entity.attributes.daily[index]];
                      });
        apex_config:
          xaxis:
            labels:
              show: false
          yaxis:
            labels:
              show: false
        card_mod:
          style: |
            ha-card { 
              box-shadow: none !important;
              margin: 0px -10px;
              padding: 0px 20px 0px 0px;
            }
  - type: custom:vertical-stack-in-card
    cards:
      - type: custom:mushroom-template-card
        primary: Coût
        secondary: ''
        icon: mdi:currency-eur
        layout: vertical
        badge_color: ''
        icon_color: orange
        tap_action:
          action: fire-dom-event
          haptic: heavy
          browser_mod:
            service: browser_mod.popup
            data:
              size: large
              content:
                type: custom:vertical-stack-in-card
                card_mod:
                  style: |
                    ha-card {
                      margin-top: 0em;
                        }         
                mode: vertical
                cards:
                  - type: entities
                    title: Coûts
                    entities:
                      - entity: sensor.myelectricaldata_consumption_xxx
                        type: custom:multiple-entity-row
                        name: Semaine
                        show_state: false
                        secondary_info: null
                        entities:
                          - entity: sensor.myelectricaldata_current_week
                            name: En cours
                          - entity: sensor.myelectricaldata_last_week
                            name: Dernière
                          - entity: sensor.myelectricaldata_last_week_cost
                            name: Coût
                      - entity: sensor.myelectricaldata_consumption_xxx
                        type: custom:multiple-entity-row
                        name: Mois
                        show_state: false
                        secondary_info: null
                        entities:
                          - entity: sensor.myelectricaldata_current_month
                            name: En cours
                          - entity: sensor.myelectricaldata_last_month
                            name: Dernière
                          - entity: sensor.myelectricaldata_last_month_cost
                            name: Coût
                      - entity: sensor.myelectricaldata_consumption_xxx
                        type: custom:multiple-entity-row
                        name: Année
                        show_state: false
                        secondary_info: null
                        entities:
                          - entity: sensor.myelectricaldata_current_year
                            name: En cours
                          - entity: sensor.myelectricaldata_last_year
                            name: Dernière
                          - entity: sensor.myelectricaldata_last_year_cost
                            name: Coût
                      - entity: sensor.myelectricaldata_last_update
                        type: custom:multiple-entity-row
                        name: Mise à jour
                        icon: mdi:update
                  - type: custom:apexcharts-card
                    color_list:
                      - orange
                    graph_span: 7d
                    span:
                      start: day
                      offset: '-7d'
                    header:
                      show: true
                      title: Journalier
                      show_states: false
                    series:
                      - entity: sensor.myelectricaldata_consumption_xxx
                        name: Coût
                        type: column
                        unit: €
                        group_by:
                          duration: 1d
                          func: max
                        opacity: 0.7
                        stroke_width: 2
                        show:
                          datalabels: true
                        data_generator: >
                          return entity.attributes.dailyweek.map((dailyweek,
                          index) => {     
                                    return [new Date(dailyweek).getTime(), entity.attributes.dailyweek_cost[index]];
                                  });
                    apex_config:
                      xaxis:
                        labels:
                          show: true
                      yaxis:
                        labels:
                          show: true
      - type: custom:mushroom-chips-card
        chips:
          - type: template
            entity: none
            icon: ''
            icon_color: orange
            content: '{{ states("sensor.myelectricaldata_yesterday_cost") }} €'
            tap_action:
              action: none
            card_mod:
              style: |
                ha-card {
                  --chip-border-width: 0;
        alignment: center
        card_mod:
          style:
            style: |
              ha-card {
                margin: -2px 0px 12px;
                --chip-background: rgba(var(--rgb-disabled), 0.15);
                --ha-card-box-shadow: none;
                --chip-border-radius: 12px;
                --chip-height: 40px;
                --chip-padding: 12px;
                --chip-spacing: 0px;
              }
      - type: custom:apexcharts-card
        color_list:
          - orange
        graph_span: 4d
        span:
          start: day
          offset: '-4d'
        header:
          show: true
          show_states: false
        series:
          - entity: sensor.myelectricaldata_consumption_xxx
            name: Coût
            type: column
            unit: €
            group_by:
              duration: 1d
              func: max
            opacity: 0.7
            stroke_width: 2
            show:
              datalabels: true
            data_generator: >
              return entity.attributes.dailyweek.map((dailyweek, index) =>
              {     
                        return [new Date(dailyweek).getTime(), entity.attributes.dailyweek_cost[index]];
                      });
        apex_config:
          xaxis:
            labels:
              show: false
          yaxis:
            labels:
              show: false
        card_mod:
          style: |
            ha-card { 
              box-shadow: none !important;
              margin: 0px -10px;
              padding: 0px 20px 0px 0px;
            }

Pour compléter, les chip card :

Capture3

Tap_action chip card « Détails » :

Capture6

Code
type: vertical-stack
cards:
  - type: custom:mushroom-chips-card
    chips:
      - type: template
        entity: sensor.myelectricaldata_current_month
        icon: mdi:chart-line-variant
        content: >-
          {% if
          'states.sensor.myelectricaldata_consumption_xxx.attributes.current_month_evolution'
          == '0' %}
            Mois: Pas de données
          {% else %}
            Mois: {{ state_attr('sensor.myelectricaldata_consumption_xxx', 'current_month_evolution') }} %
          {% endif %}
        icon_color: green
        tap_action:
          action: none
      - type: template
        entity: sensor.myelectricaldata_current_week
        tap_action:
          action: none
        icon: mdi:chart-line-variant
        content: >-
          {% if
          'states.sensor.myelectricaldata_consumption_xxx.attributes.current_week_evolution'
          == '0' %}
            Semaine: Pas de données
          {% else %}
            Semaine: {{ state_attr('sensor.myelectricaldata_consumption_xxx', 'current_week_evolution') }} %
          {% endif %}
        icon_color: green
      - type: template
        content: Détails
        icon: mdi:poll
        tap_action:
          action: fire-dom-event
          haptic: heavy
          browser_mod:
            service: browser_mod.popup
            data:
              style: |-
                --popup-background-color: transperant;
                --popup-border-radius: 15px;
                --popup-border-color: transparent;
                --popup-padding-x: 5px;
              size: normal
              content:
                type: custom:apexcharts-card
                graph_span: 7d
                span:
                  start: day
                  offset: '-7d'
                header:
                  show: true
                  title: Détails
                  show_states: false
                series:
                  - entity: sensor.myelectricaldata_consumption_xxx
                    name: Conso
                    type: column
                    color: deepskyblue
                    group_by:
                      duration: 1d
                      func: max
                    opacity: 0.7
                    stroke_width: 2
                    show:
                      datalabels: true
                    data_generator: >
                      return entity.attributes.dailyweek.map((dailyweek, index)
                      => {     
                        return [new Date(dailyweek).getTime(), entity.attributes.daily[index]];
                      });
                  - entity: sensor.myelectricaldata_consumption_xxx
                    name: Coût
                    unit: €
                    color: orange
                    type: column
                    group_by:
                      duration: 1d
                      func: max
                    opacity: 0.7
                    stroke_width: 2
                    show:
                      datalabels: true
                    data_generator: >
                      return entity.attributes.dailyweek.map((dailyweek, index)
                      => {     
                         return [new Date(dailyweek).getTime(), entity.attributes.dailyweek_cost[index]];
                       });
                apex_config:
                  xaxis:
                    labels:
                      show: true
                  yaxis:
                    labels:
                      show: true
                  legend:
                    show: true
    alignment: center

3 « J'aime »

J’ai une erreur dans le template:

Une erreur du template que je loupe ?

Autant pour moi, j’ai oublié que j’avais bidouillé un template :wink:
Voici le code:

---
### Icon Info Custom ###
icon_info_custom:
  color: "var(--google-grey)"
  show_icon: true
  show_label: true
  show_name: false
  state:
    - value: "unavailable"
      styles:
        custom_fields:
          notification:
            - border-radius: "50%"
            - position: "absolute"
            - left: "38px"
            - top: "8px"
            - height: "16px"
            - width: "16px"
            - border: "2px solid var(--card-background-color)"
            - font-size: "12px"
            - line-height: "14px"
            - background-color: >
                [[[
                  return "rgba(var(--color-red),1)";
                ]]]
  styles:
    icon:
      - color: "rgba(var(--color-theme),0.2)"
    label:
      - justify-self: "center"
      - align-self: "center"
      - font-weight: "bold"
      - font-size: "12px"
      - filter: "opacity(40%)"
      - margin-left: "12px"
    state:
      - justify-self: "start"
      - align-self: "start"
      - font-weight: "bold"
      - font-size: "12px"
      - filter: "opacity(40%)"
      - margin-left: "12px"
    img_cell:
      - background-color: "rgba(var(--color-theme),0.05)"
      - border-radius: "50%"
      - place-self: "center"
      - width: "42px"
      - height: "42px"
    grid:
      - grid-template-areas: "'i l' 'i l'"
      - grid-template-columns: "min-content auto"
      - grid-template-rows: "min-content min-content"
    card:
      - border-radius: "var(--border-radius)"
      - box-shadow: "var(--box-shadow)"
      - padding: "12px"
  custom_fields:
    notification: >
      [[[
        if (entity.state =="unavailable"){
          return `<ha-icon icon="mdi:exclamation" style="width: 12px; height: 12px; color: var(--primary-background-color);"></ha-icon>`
        }
      ]]]
  size: "20px"
1 « J'aime »

Merci :slight_smile:

il est plus bon ton prix/kwh,… :confused:
Il me semble qu’il y des entité pour gérer des tarifs non ?

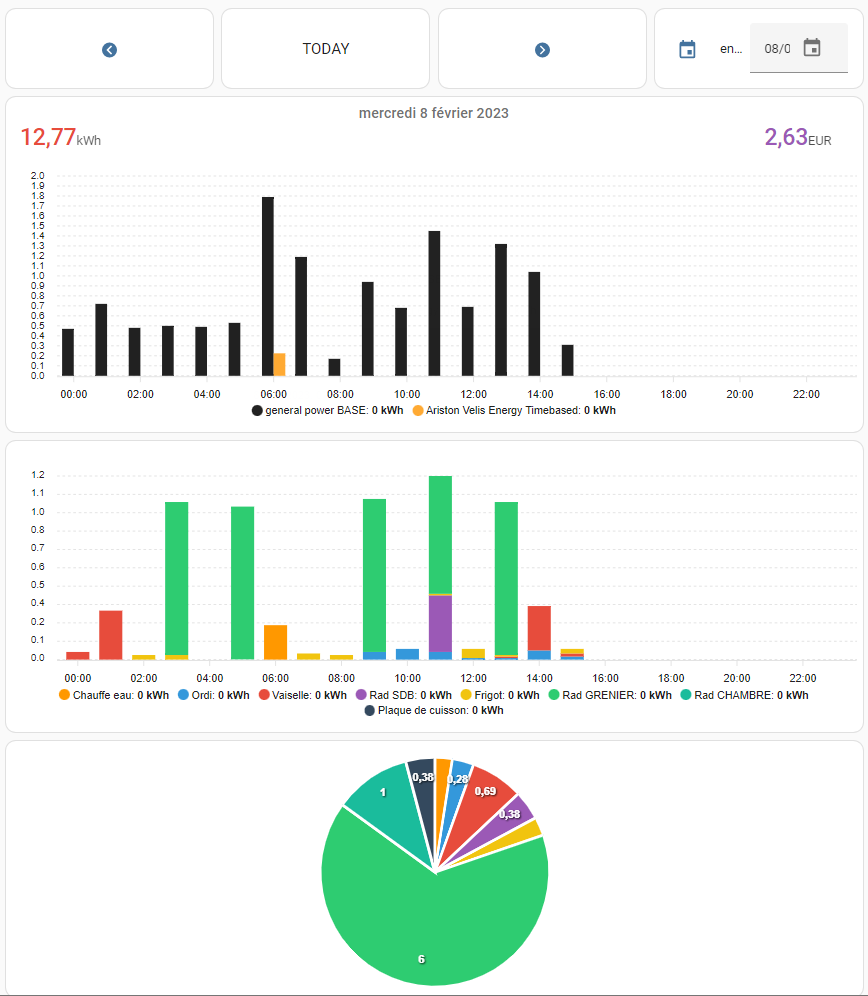
Une façon différente de voir la conso journalière toujours avec un apexchart est un input.datetime :

Le code pour choisir la date du graph :

type: custom:config-template-card
entities:
  - input_datetime.energy_viewer
variables:
  DAY: |
    {
    var targetDate = states['input_datetime.energy_viewer'].state;
    var myDate = states['input_datetime.energy_viewer'].state.split("-");
    var newDate = new Date( myDate[2], myDate[1] - 1, myDate[0]);  
    var offSet = Math.ceil((Date.parse(targetDate) - Date.now()) / 86400000)
    var sign = offSet < 0 ? "" : "+";
     sign + offSet +  "d" ;
    };
  TITLE: >
    var targetDate = states['input_datetime.energy_viewer'].state

    const options = { weekday: 'long', year: 'numeric', month: 'long', day:
    'numeric' };

    new Date(targetDate).toLocaleDateString("fr", options);
card:
  type: custom:apexcharts-card
  graph_span: 24h
  span:
    start: day
    offset: ${DAY}
4 « J'aime »

Hellom

certainement @Uowis et je ne demande qu a decouvrir, il y encore un mois je ne savais meme pas ce que ct home assistant. Si jamais tu as qques liens a partager je prends!

Whaoou Révolution ! Je savais pas non plus que c’était possible.
Si jamais tu as de l’infos sur comment réaliser ça je suis preneur.
C’est pas mal pour approfondir une date quand tu veux voir ce qu’il se passe en détail.

Sympa comme dashboard, tu peut partager l’ensemble pour faire ces graphs ?

Bonjour,

je n’ai pas compris comment récupérer le token myelectricaldata, pouvez-vous m’expliquer s’il vous plait ?

Merci

En lisant la Doc par exemple.
https://myelectricaldata.fr/

Déjà lu mais ça ne fonctionne pas.

La page est en erreur 404 depuis le 27 janvier, il y a soucis enedis mais vraiment merci @cob94440 pour ton aide précieuse et ta solicitude.

Est tu sais pas changé le prix du kwh et te semble difficile ??

:joy: :joy:

Allez je te lai fait

consumption_2121xxxxxx42249.attributes.current_week|float*0.2062

voila comme ca le prix est bon maintenant !!

@david8265, tout a fait @M4dm4rtig4n travaille dessus actuelement , il attent un retour de edf qui se presse pas …
Tu peux regarder sur son git les avancé

ou sur ce topic

Et un ticket est ouvert dessus. Donc comme je dis il suffit de lire. Rien de méchant dans mon propos juste que chaque jour un post sur ce problème c’est bon on a compris.

merci pour le partage , c’est magnifique , j’adopte

1 « J'aime »

Merci pour le partage. Je ferais l’install quand lorsque les consentements remarcheront.
Je vais en avoir deux à faire. Un pour la consommation, un pour la production
Et c’est surtout la deuxième qui m’intéresse.
Est-ce qu’il est possible de charger la bdd avec mes données actuelles de production (soit 12 ans de prod) ?
Est-ce que la map permet d’avoir une vue de la prod mensuelle ou annuelle ?

Pourquoi charger cette bdd, ça ne sert que pour MED et dès qu’il y a des soucis/changements serieux, il faut commencer de 0 et toi a recharger tout.C’est quoi ton bût?

Pouvoir comparer la prod d’un mois donné par rapport aux années précédentes, pour identifier une baisse production

Je pense que c’est mieux de charger la bdd de HA (dans table statistics)