FROlCi
Février 24, 2023, 4:17
62
Hello,
Attention, dans l’erreur de gauche il y a aussi des sensors « water » pour l’eau. Si tu n’as pas encore travaillé sur ce sujet il vaut mieux les enlever
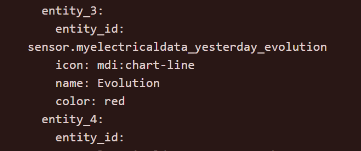
    myelectricaldata_yesterday_evolution:
      value_template: "{{ states.sensor.myelectricaldata_consumption_22325470269040.attributes.yesterday_evolution }}"
      friendly_name: "Evolution avant-hier"
      unit_of_measurement: "%"
Voili voilou de quoi commencer ^^
1 « J'aime »
Bonsoir tout le monde,
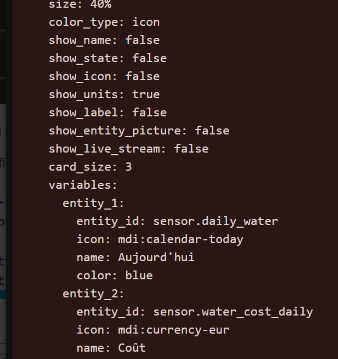
Petite question concernant l’intégration du template custom_card_apexcharts_elec.
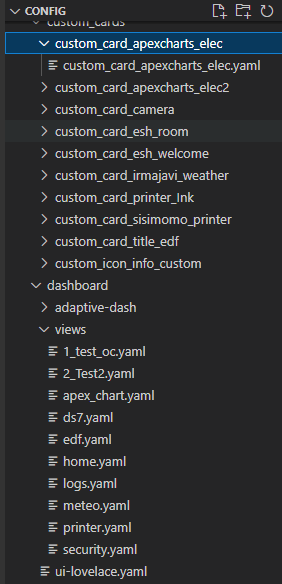
J’ai bien crée l’arborescence: custom_cards > custom_card_apexcharts_elec > custom_card_apexcharts_elec.yaml
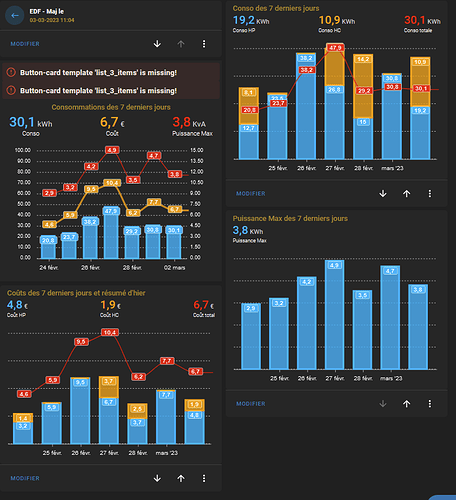
Dans le .yaml , je démarre bien avec : custom_card_apexcharts_elec: en 1ère ligne.@FROlCi ou @Galadan déclaré le template: "custom_card_apexcharts_elec" dans ma vue.Button-card template 'custom_card_apexcharts_elec' is missing!
Je dois oublier un chemin quelque part mais je sèche un peu.
Bonsoir @fana13
et comment j’appelle chacune des entrées:
button_card_templates: !include_dir_merge_named "../../custom_components/ui_lovelace_minimalist/__ui_minimalist__/ulm_templates/"
theme: "minimalist-desktop"
title: "Minimalist"
background: "var(--background-image)"
views:
  - !include views/home.yaml
  - !include views/edf.yaml
  - !include views/security.yaml
  - !include views/printer.yaml
  - !include views/ds7.yaml
  - !include views/apex_chart.yaml
  - !include views/meteo.yaml
  - !include views/2_Test2.yaml
  - !include views/logs.yaml
Et un bout de la carte edf.yaml:
Résumé
title: "EDF"
path: "edf"
cards:
  - type: horizontal-stack
    cards:
      - type: custom:mushroom-entity-card
        entity: sensor.myelectricaldata_last_update
        icon_type: icon
        name: EDF - Maj le
        tap_action:
          action: navigate
          navigation_path: /ui-lovelace-minimalist/home
        hold_action:
          action: none
        double_tap_action:
          action: none
        icon: mdi:keyboard-backspace
        icon_color: light-blue
        fill_container: false

  - type: vertical-stack
    cards:
      - type: custom:button-card
        template: "card_apexcharts_elec"
        variables:
          graph_span: "7d"
          entity_1:
            entity_id: "sensor.myelectricaldata_yesterday"
            icon: "mdi:flash"
            name: "Hier"
            color: "blue"
          entity_2:
            entity_id: "sensor.myelectricaldata_current_week"
            icon: "mdi:flash"
            name: "Semaine"
            color: "yellow"
          entity_3:
            entity_id: "sensor.myelectricaldata_current_month"
            icon: "mdi:flash"
            name: "Mois"
            color: "green"
          entity_4:
            entity_id: "sensor.myelectricaldata_current_year"
            icon: "mdi:flash"
            name: "Année"
            color: "pink"
          entity_5:
            entity_id: "sensor.myelectricaldata_subscribed_power"
            icon: "mdi:flash"
            name: "Puissance"
            color: "red"
          entity_6:
            entity_id: "sensor.myelectricaldata_yesterdayconsumptionmaxpower"
            icon: "mdi:flash"
            name: "P. Max hier"
            color: "purple"
      - type: custom:apexcharts-card
        graph_span: 7d
        span:
          start: day
          offset: "-7d"
        header:
          show: true
          title: Coûts des 7 derniers jours et résumé d'hier
          show_states: true
          colorize_states: true
        series:
          - entity: sensor.myelectricaldata_consumption_22325470269040
            yaxis_id: gauche
            name: Coût HP
            unit: €
            color: deepskyblue
            type: column
            group_by:
              duration: 1d
              func: max
            opacity: 0.8
            stroke_width: 4
            show:
              datalabels: true
            data_generator: >
              return entity.attributes.dailyweek.map((dailyweek, index) =>
              {
                        return [new Date(dailyweek).getTime(), entity.attributes.dailyweek_costHP[index]];
                      });
          - entity: sensor.myelectricaldata_consumption_22325470269040
            yaxis_id: gauche
            name: Coût HC
            unit: €
            color: orange
            type: column
            group_by:
              duration: 1d
              func: max
            opacity: 0.8
            stroke_width: 4
            show:
              datalabels: true
            data_generator: >
              return entity.attributes.dailyweek.map((dailyweek, index) =>
              {
                        return [new Date(dailyweek).getTime(), entity.attributes.dailyweek_costHC[index]];
                      });
          - entity: sensor.myelectricaldata_consumption_22325470269040
            yaxis_id: droite
            name: Coût total
            unit: €
            color: red
            type: line
            group_by:
              duration: 1d
              func: max
            opacity: 0.8
            stroke_width: 2
            show:
              datalabels: true
            data_generator: >
              return entity.attributes.dailyweek.map((dailyweek, index) =>
              {
                        return [new Date(dailyweek).getTime(), entity.attributes.dailyweek_cost[index]];
                      });
        apex_config:
          xaxis:
            labels:
              show: true
          yaxis:
            - id: gauche
              min: 0
              forceNiceScale: true
              max: 15 #|
#                EVAL: function(max) { return max }
              opposite: false
              labels:
                show: false
            - id: droite
              min: 0
              forceNiceScale: true
              max: 20 #|
#                EVAL: function(max) { return max }
              opposite: true
              labels:
                show: false
          legend:
            show: false
          chart:
            stacked: true
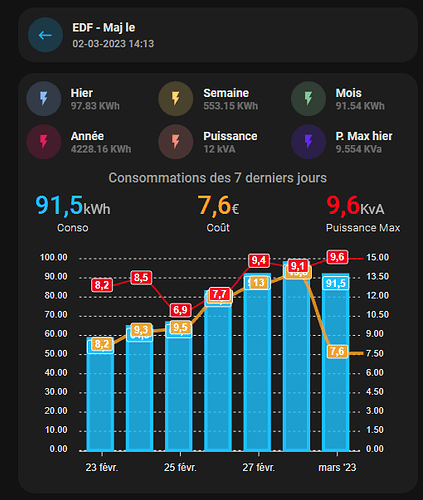
qui affiche cela
2 « J'aime »
Super boulot. Aurais tu le contenu de ton template stp
Hello @FROlCi , il semble que ton code ne correspond pas a ton screen
Hello,
Oui c’est pourquoi j’ai écrit un bout the code ^^
Voici le code que j’ai reutilisé et un tout petit peu adapté grâce à beaucoup d’entres vous (@Galadan , @ClassicRed etc…) - je reco aussi de regarder ce que fait @Galadan car c encore mieux ^^ ; et voici le code complet de cette fameuse carte pour @cob94440 :
Carte EDF
title: "EDF"
path: "edf"
cards:
  - type: horizontal-stack
    cards:
      - type: custom:mushroom-entity-card
        entity: sensor.myelectricaldata_last_update
        icon_type: icon
        name: EDF - Maj le
        tap_action:
          action: navigate
          navigation_path: /ui-lovelace-minimalist/home
        hold_action:
          action: none
        double_tap_action:
          action: none
        icon: mdi:keyboard-backspace
        icon_color: light-blue
        fill_container: false

  - type: vertical-stack
    cards:
      - type: custom:button-card
        template: "card_apexcharts_elec"
        variables:
          graph_span: "7d"
          entity_1:
            entity_id: "sensor.myelectricaldata_yesterday"
            icon: "mdi:flash"
            name: "Hier"
            color: "blue"
          entity_2:
            entity_id: "sensor.myelectricaldata_current_week"
            icon: "mdi:flash"
            name: "Semaine"
            color: "yellow"
          entity_3:
            entity_id: "sensor.myelectricaldata_current_month"
            icon: "mdi:flash"
            name: "Mois"
            color: "green"
          entity_4:
            entity_id: "sensor.myelectricaldata_current_year"
            icon: "mdi:flash"
            name: "Année"
            color: "pink"
          entity_5:
            entity_id: "sensor.myelectricaldata_subscribed_power"
            icon: "mdi:flash"
            name: "Puissance"
            color: "red"
          entity_6:
            entity_id: "sensor.myelectricaldata_yesterdayconsumptionmaxpower"
            icon: "mdi:flash"
            name: "P. Max hier"
            color: "purple"
      - type: custom:apexcharts-card
        graph_span: 7d
        span:
          start: day
          offset: "-7d"
        header:
          show: true
          title: Coûts des 7 derniers jours et résumé d'hier
          show_states: true
          colorize_states: true
        series:
          - entity: sensor.myelectricaldata_consumption_22325470269040
            yaxis_id: gauche
            name: Coût HP
            unit: €
            color: deepskyblue
            type: column
            group_by:
              duration: 1d
              func: max
            opacity: 0.8
            stroke_width: 4
            show:
              datalabels: true
            data_generator: >
              return entity.attributes.dailyweek.map((dailyweek, index) =>
              {
                        return [new Date(dailyweek).getTime(), entity.attributes.dailyweek_costHP[index]];
                      });
          - entity: sensor.myelectricaldata_consumption_22325470269040
            yaxis_id: gauche
            name: Coût HC
            unit: €
            color: orange
            type: column
            group_by:
              duration: 1d
              func: max
            opacity: 0.8
            stroke_width: 4
            show:
              datalabels: true
            data_generator: >
              return entity.attributes.dailyweek.map((dailyweek, index) =>
              {
                        return [new Date(dailyweek).getTime(), entity.attributes.dailyweek_costHC[index]];
                      });
          - entity: sensor.myelectricaldata_consumption_22325470269040
            yaxis_id: droite
            name: Coût total
            unit: €
            color: red
            type: line
            group_by:
              duration: 1d
              func: max
            opacity: 0.8
            stroke_width: 2
            show:
              datalabels: true
            data_generator: >
              return entity.attributes.dailyweek.map((dailyweek, index) =>
              {
                        return [new Date(dailyweek).getTime(), entity.attributes.dailyweek_cost[index]];
                      });
        apex_config:
          xaxis:
            labels:
              show: true
          yaxis:
            - id: gauche
              min: 0
              forceNiceScale: true
              max: 15 #|
#                EVAL: function(max) { return max }
              opposite: false
              labels:
                show: false
            - id: droite
              min: 0
              forceNiceScale: true
              max: 20 #|
#                EVAL: function(max) { return max }
              opposite: true
              labels:
                show: false
          legend:
            show: false
          chart:
            stacked: true
  # Conso
  - type: vertical-stack
    cards:
      - type: custom:apexcharts-card
        graph_span: 7d
        span:
          start: day
          offset: "-7d"
        header:
          show: true
          title: Conso des 7 derniers jours
          show_states: true
          colorize_states: true
        series:
          - entity: sensor.myelectricaldata_consumption_22325470269040
            yaxis_id: gauche
            name: Conso HP
            unit: KWh
            color: deepskyblue
            type: column
            group_by:
              duration: 1d
              func: max
            opacity: 0.8
            stroke_width: 4
            show:
              datalabels: true
            data_generator: >
              return entity.attributes.dailyweek.map((dailyweek, index) =>
              {
                        return [new Date(dailyweek).getTime(), entity.attributes.dailyweek_HP[index]];
                      });
          - entity: sensor.myelectricaldata_consumption_22325470269040
            yaxis_id: gauche
            name: Conso HC
            unit: KWh
            color: orange
            type: column
            group_by:
              duration: 1d
              func: max
            opacity: 0.8
            stroke_width: 4
            show:
              datalabels: true
            data_generator: >
              return entity.attributes.dailyweek.map((dailyweek, index) =>
              {
                        return [new Date(dailyweek).getTime(), entity.attributes.dailyweek_HC[index]];
                      });
          - entity: sensor.myelectricaldata_consumption_22325470269040
            yaxis_id: droite
            name: Conso totale
            unit: KWh
            color: red
            type: line
            group_by:
              duration: 1d
              func: max
            opacity: 0.8
            stroke_width: 2
            show:
              datalabels: true
            data_generator: >
              return entity.attributes.dailyweek.map((dailyweek, index) =>
              {
                        return [new Date(dailyweek).getTime(), entity.attributes.daily[index]];
                      });
        apex_config:
          xaxis:
            labels:
              show: true
          yaxis:
            - id: gauche
              min: 0
              forceNiceScale: true
              max: |
                EVAL: function(max) { return max }

              opposite: false
              labels:
                show: false
            - id: droite
              min: 0
              forceNiceScale: true
              max: |
                EVAL: function(max) { return max }

              opposite: true
              labels:
                show: false
          legend:
            show: false
          chart:
            stacked: true
  # PM
  - type: vertical-stack
    cards:
      - type: custom:apexcharts-card
        graph_span: 7d
        span:
          start: day
          offset: "-7d"
        header:
          show: true
          title: Puissance Max des 7 derniers jours
          show_states: true
          colorize_states: true
        series:
          - entity: sensor.myelectricaldata_consumption_22325470269040
            yaxis_id: gauche
            name: Puissance Max
            unit: KWh
            color: deepskyblue
            type: column
            group_by:
              duration: 1d
              func: max
            opacity: 0.8
            stroke_width: 4
            show:
              datalabels: true
            data_generator: >
              return entity.attributes.dailyweek.map((dailyweek, index) =>
              {
                        return [new Date(dailyweek).getTime(), entity.attributes.dailyweek_MP[index]];
                      });
        apex_config:
          xaxis:
            labels:
              show: true
          yaxis:
            - id: gauche
              #              min: 0
              forceNiceScale: true
              max: |
                EVAL: function(max) { return max }

              opposite: false
              labels:
                show: false
            - id: droite
              #              min: 0
              forceNiceScale: true
              max: |
                EVAL: function(max) { return max }

              opposite: true
              labels:
                show: false
          legend:
            show: false
          chart:
            column: true
PS: regardez ce fil pour intégrer votre production : c assez impressionant ^^
Bonjour à la communauté
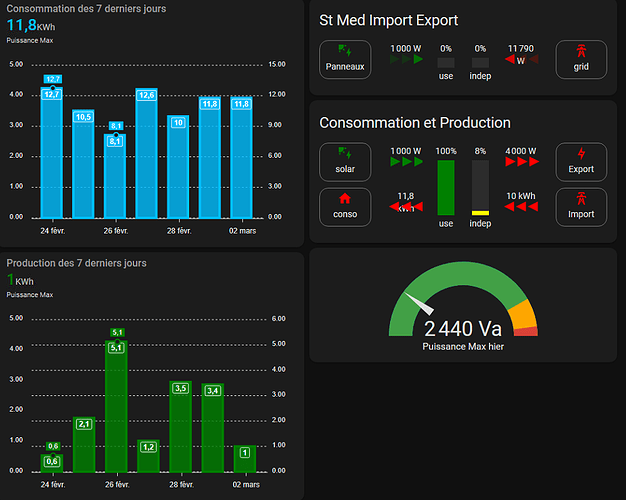
J’utilise l’intégration Enphase Envoy pour les panneaux solaires, mais je ne suis pas super satisfait de mon intégration dans lovelace
La page d’origine d’enphase utilise des choses comme
« indépendance énergétique »
'import net"
« exporté »
Avez-vous des exemples de vos intégration s’il vous plait merci
[01] [02]
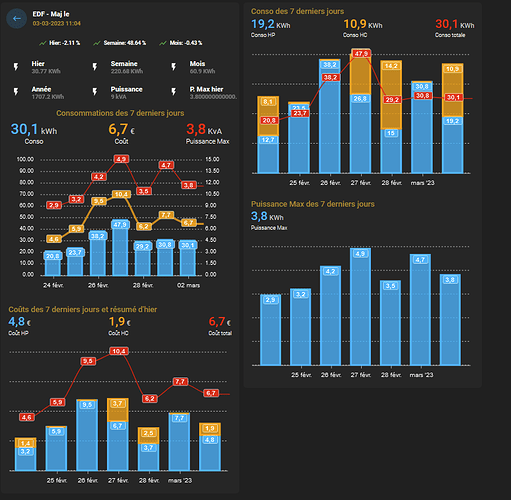
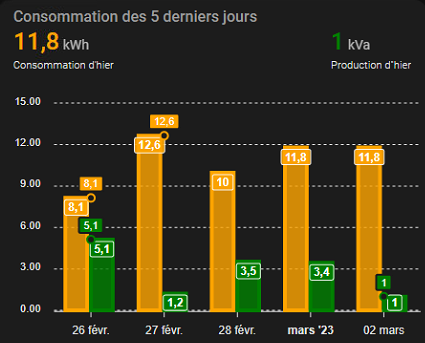
Je suis en train d’adapter cela pour uniquement s’appuyer sur Myelectricaldata et cela donne cela en alpha version :
1 « J'aime »
Mieux ? Je suis pas certain !
Bon boulot!!
FROlCi:
Hello,
Oui c’est pourquoi j’ai écrit un bout the code ^^
Voici le code que j’ai reutilisé et un tout petit peu adapté grâce à beaucoup d’entres vous (@Galadan , @ClassicRed etc…) - je reco aussi de regarder ce que fait @Galadan car c encore mieux ^^ ; et voici le code complet de cette fameuse carte pour @cob94440 :
Carte EDF
title: "EDF"
path: "edf"
cards:
  - type: horizontal-stack
    cards:
      - type: custom:mushroom-entity-card
        entity: sensor.myelectricaldata_last_update
        icon_type: icon
        name: EDF - Maj le
        tap_action:
          action: navigate
          navigation_path: /ui-lovelace-minimalist/home
        hold_action:
          action: none
        double_tap_action:
          action: none
        icon: mdi:keyboard-backspace
        icon_color: light-blue
        fill_container: false

  - type: vertical-stack
    cards:
      - type: custom:button-card
        template: "card_apexcharts_elec"
        variables:
          graph_span: "7d"
          entity_1:
            entity_id: "sensor.myelectricaldata_yesterday"
            icon: "mdi:flash"
            name: "Hier"
            color: "blue"
          entity_2:
            entity_id: "sensor.myelectricaldata_current_week"
            icon: "mdi:flash"
            name: "Semaine"
            color: "yellow"
          entity_3:
            entity_id: "sensor.myelectricaldata_current_month"
            icon: "mdi:flash"
            name: "Mois"
            color: "green"
          entity_4:
            entity_id: "sensor.myelectricaldata_current_year"
            icon: "mdi:flash"
            name: "Année"
            color: "pink"
          entity_5:
            entity_id: "sensor.myelectricaldata_subscribed_power"
            icon: "mdi:flash"
            name: "Puissance"
            color: "red"
          entity_6:
            entity_id: "sensor.myelectricaldata_yesterdayconsumptionmaxpower"
            icon: "mdi:flash"
            name: "P. Max hier"
            color: "purple"
      - type: custom:apexcharts-card
        graph_span: 7d
        span:
          start: day
          offset: "-7d"
        header:
          show: true
          title: Coûts des 7 derniers jours et résumé d'hier
          show_states: true
          colorize_states: true
        series:
          - entity: sensor.myelectricaldata_consumption_22325470269040
            yaxis_id: gauche
            name: Coût HP
            unit: €
            color: deepskyblue
            type: column
            group_by:
              duration: 1d
              func: max
            opacity: 0.8
            stroke_width: 4
            show:
              datalabels: true
            data_generator: >
              return entity.attributes.dailyweek.map((dailyweek, index) =>
              {
                        return [new Date(dailyweek).getTime(), entity.attributes.dailyweek_costHP[index]];
                      });
          - entity: sensor.myelectricaldata_consumption_22325470269040
            yaxis_id: gauche
            name: Coût HC
            unit: €
            color: orange
            type: column
            group_by:
              duration: 1d
              func: max
            opacity: 0.8
            stroke_width: 4
            show:
              datalabels: true
            data_generator: >
              return entity.attributes.dailyweek.map((dailyweek, index) =>
              {
                        return [new Date(dailyweek).getTime(), entity.attributes.dailyweek_costHC[index]];
                      });
          - entity: sensor.myelectricaldata_consumption_22325470269040
            yaxis_id: droite
            name: Coût total
            unit: €
            color: red
            type: line
            group_by:
              duration: 1d
              func: max
            opacity: 0.8
            stroke_width: 2
            show:
              datalabels: true
            data_generator: >
              return entity.attributes.dailyweek.map((dailyweek, index) =>
              {
                        return [new Date(dailyweek).getTime(), entity.attributes.dailyweek_cost[index]];
                      });
        apex_config:
          xaxis:
            labels:
              show: true
          yaxis:
            - id: gauche
              min: 0
              forceNiceScale: true
              max: 15 #|
#                EVAL: function(max) { return max }
              opposite: false
              labels:
                show: false
            - id: droite
              min: 0
              forceNiceScale: true
              max: 20 #|
#                EVAL: function(max) { return max }
              opposite: true
              labels:
                show: false
          legend:
            show: false
          chart:
            stacked: true
  # Conso
  - type: vertical-stack
    cards:
      - type: custom:apexcharts-card
        graph_span: 7d
        span:
          start: day
          offset: "-7d"
        header:
          show: true
          title: Conso des 7 derniers jours
          show_states: true
          colorize_states: true
        series:
          - entity: sensor.myelectricaldata_consumption_22325470269040
            yaxis_id: gauche
            name: Conso HP
            unit: KWh
            color: deepskyblue
            type: column
            group_by:
              duration: 1d
              func: max
            opacity: 0.8
            stroke_width: 4
            show:
              datalabels: true
            data_generator: >
              return entity.attributes.dailyweek.map((dailyweek, index) =>
              {
                        return [new Date(dailyweek).getTime(), entity.attributes.dailyweek_HP[index]];
                      });
          - entity: sensor.myelectricaldata_consumption_22325470269040
            yaxis_id: gauche
            name: Conso HC
            unit: KWh
            color: orange
            type: column
            group_by:
              duration: 1d
              func: max
            opacity: 0.8
            stroke_width: 4
            show:
              datalabels: true
            data_generator: >
              return entity.attributes.dailyweek.map((dailyweek, index) =>
              {
                        return [new Date(dailyweek).getTime(), entity.attributes.dailyweek_HC[index]];
                      });
          - entity: sensor.myelectricaldata_consumption_22325470269040
            yaxis_id: droite
            name: Conso totale
            unit: KWh
            color: red
            type: line
            group_by:
              duration: 1d
              func: max
            opacity: 0.8
            stroke_width: 2
            show:
              datalabels: true
            data_generator: >
              return entity.attributes.dailyweek.map((dailyweek, index) =>
              {
                        return [new Date(dailyweek).getTime(), entity.attributes.daily[index]];
                      });
        apex_config:
          xaxis:
            labels:
              show: true
          yaxis:
            - id: gauche
              min: 0
              forceNiceScale: true
              max: |
                EVAL: function(max) { return max }

              opposite: false
              labels:
                show: false
            - id: droite
              min: 0
              forceNiceScale: true
              max: |
                EVAL: function(max) { return max }

              opposite: true
              labels:
                show: false
          legend:
            show: false
          chart:
            stacked: true
  # PM
  - type: vertical-stack
    cards:
      - type: custom:apexcharts-card
        graph_span: 7d
        span:
          start: day
          offset: "-7d"
        header:
          show: true
          title: Puissance Max des 7 derniers jours
          show_states: true
          colorize_states: true
        series:
          - entity: sensor.myelectricaldata_consumption_22325470269040
            yaxis_id: gauche
            name: Puissance Max
            unit: KWh
            color: deepskyblue
            type: column
            group_by:
              duration: 1d
              func: max
            opacity: 0.8
            stroke_width: 4
            show:
              datalabels: true
            data_generator: >
              return entity.attributes.dailyweek.map((dailyweek, index) =>
              {
                        return [new Date(dailyweek).getTime(), entity.attributes.dailyweek_MP[index]];
                      });
        apex_config:
          xaxis:
            labels:
              show: true
          yaxis:
            - id: gauche
              #              min: 0
              forceNiceScale: true
              max: |
                EVAL: function(max) { return max }

              opposite: false
              labels:
                show: false
            - id: droite
              #              min: 0
              forceNiceScale: true
              max: |
                EVAL: function(max) { return max }

              opposite: true
              labels:
                show: false
          legend:
            show: false
          chart:
            column: true
PS: regardez ce fil pour intégrer votre production : c assez impressionant ^^Panneaux Solaire Enphase Envoy
Davantage que la carte, c’est le template qui me manque. j’ai tenté avec celui de Galadan sans succès
Voila! attention c’est sur une base minimalist…
Template
---
card_apexcharts_elec:
  template:
  - "ulm_translation_engine"
  variables:
    entity_1:
      entity_id:
      icon: "[[[ return entity.attributes.icon ]]]"
      name: "[[[ return entity.attributes.friendly_name ]]]"
      color: >
        [[[
          var colors = ['yellow', 'blue', 'red', 'green'];
          var color = colors[Math.floor(Math.random() * colors.length)];
          return color;
        ]]]
    entity_2:
      entity_id:
      icon: "[[[ return entity.attributes.icon  ]]]"
      name: "[[[ return entity.attributes.friendly_name ]]]"
      color: >
        [[[
          var colors = ['yellow', 'blue', 'red', 'green'];
          var color = colors[Math.floor(Math.random() * colors.length)];
          return color;
        ]]]
    entity_3:
      entity_id:
      icon: "[[[ return entity.attributes.icon  ]]]"
      name: "[[[ return entity.attributes.friendly_name ]]]"
      color: >
        [[[
          var colors = ['yellow', 'blue', 'red','green'];
          var color = colors[Math.floor(Math.random() * colors.length)];
          return color;
        ]]]
    entity_4:
      entity_id:
      icon: "[[[ return entity.attributes.icon  ]]]"
      name: "[[[ return entity.attributes.friendly_name ]]]"
      color: >
        [[[
          var colors = ['yellow', 'blue', 'red','green'];
          var color = colors[Math.floor(Math.random() * colors.length)];
          return color;
        ]]]
    entity_5:
      entity_id:
      icon: "[[[ return entity.attributes.icon  ]]]"
      name: "[[[ return entity.attributes.friendly_name ]]]"
      color: >
        [[[
          var colors = ['yellow', 'blue', 'red','green'];
          var color = colors[Math.floor(Math.random() * colors.length)];
          return color;
        ]]]
    entity_6:
      entity_id:
      icon: "[[[ return entity.attributes.icon  ]]]"
      name: "[[[ return entity.attributes.friendly_name ]]]"
      color: >
        [[[
          var colors = ['yellow', 'blue', 'red','green'];
          var color = colors[Math.floor(Math.random() * colors.length)];
          return color;
        ]]]
  color: "auto"
  variable: "spin"
  spin: false
  show_name: false
  show_state: false
  show_label: false
  show_icon: false
  show_last_changed: true
  show_entity_picture: false
  styles:
    grid:
      - grid-template-areas: "'item1' 'item2' 'radial'"
      - grid-template-columns: 1fr
      - grid-template-rows: min-content min-content min-content
    card:
      - border-radius: "var(--border-radius)"
      - padding: "5px"
  custom_fields:
    item1:
      card:
        type: custom:button-card
        template: list_3_items
        custom_fields:
            item1:
              card:
                type: "custom:button-card"
                entity: "[[[ return variables.entity_1.entity_id ]]]"
                name: "[[[ return variables.entity_1.name ]]]"
                icon: "[[[ return variables.entity_1.icon ]]]"
                template:
                  - "icon_info_bg"
                variables:
                  ulm_card_generic_swap_icon: "[[[ return variables.entity_1.icon ]]]"
                styles:
                  icon:
                    - color: "[[[ return `rgba(var(--color-${variables.entity_1.color}), 1)`;]]]"
                  img_cell:
                    - background-color: "[[[ return `rgba(var(--color-${variables.entity_1.color}), 0.20)`;]]]"
                  card:
                    - box-shadow: "none"
                    - border-radius: "none"
                    - width: "auto"
                    - padding: "5px"
                label: |
                  [[[
                          return states[variables.entity_1.entity_id].state + " KWh";
                  ]]]
            item2:
              card:
                type: "custom:button-card"
                entity: "[[[ return variables.entity_2.entity_id ]]]"
                name: "[[[ return variables.entity_2.name ]]]"
                icon: "[[[ return variables.entity_2.icon ]]]"
                template:
                  - "icon_info_bg"
                #variables:
                #  ulm_card_generic_swap_icon: "[[[ return variables.entity_2.icon ]]]"
                styles:
                  icon:
                    - color: "[[[ return `rgba(var(--color-${variables.entity_2.color}), 1)`;]]]"
                  img_cell:
                    - background-color: "[[[ return `rgba(var(--color-${variables.entity_2.color}), 0.20)`;]]]"
                  card:
                    - box-shadow: "none"
                    - border-radius: "none"
                    - width: "auto"
                    - padding: "5px"
                label: |
                  [[[
                          return states[variables.entity_2.entity_id].state + " KWh";
                  ]]]
            item3:
              card:
                type: "custom:button-card"
                entity: "[[[ return variables.entity_3.entity_id ]]]"
                name: "[[[ return variables.entity_3.name ]]]"
                icon: "[[[ return variables.entity_3.icon ]]]"
                template:
                  - "icon_info_bg"
                #variables:
                #  ulm_card_generic_swap_icon: "[[[ return variables.entity_3.icon ]]]"
                styles:
                  icon:
                    - color: "[[[ return `rgba(var(--color-${variables.entity_3.color}), 1)`;]]]"
                  img_cell:
                    - background-color: "[[[ return `rgba(var(--color-${variables.entity_3.color}), 0.20)`;]]]"
                  card:
                    - box-shadow: "none"
                    - border-radius: "none"
                    - width: "auto"
                    - padding: "5px"
                label: |
                  [[[
                          return states[variables.entity_3.entity_id].state + " KWh";
                  ]]]
    item2:
      card:
        type: custom:button-card
        template: list_3_items
        custom_fields:
            item1:
              card:
                type: "custom:button-card"
                entity: "[[[ return variables.entity_4.entity_id ]]]"
                name: "[[[ return variables.entity_4.name ]]]"
                icon: "[[[ return variables.entity_4.icon ]]]"
                template:
                  - "icon_info_bg"
                #variables:
                #  ulm_card_generic_swap_icon: "[[[ return variables.entity_4.icon ]]]"
                styles:
                  icon:
                    - color: "[[[ return `rgba(var(--color-${variables.entity_4.color}), 1)`;]]]"
                  img_cell:
                    - background-color: "[[[ return `rgba(var(--color-${variables.entity_4.color}), 0.20)`;]]]"
                  card:
                    - box-shadow: "none"
                    - border-radius: "none"
                    - width: "auto"
                    - padding: "5px"
                label: |
                  [[[
                          return states[variables.entity_4.entity_id].state + " KWh";
                  ]]]
            item2:
              card:
                type: "custom:button-card"
                entity: "[[[ return variables.entity_5.entity_id ]]]"
                name: "[[[ return variables.entity_5.name ]]]"
                icon: "[[[ return variables.entity_5.icon ]]]"
                template:
                  - "icon_info_bg"
                #variables:
                #  ulm_card_generic_swap_icon: "[[[ return variables.entity_4.icon ]]]"
                styles:
                  icon:
                    - color: "[[[ return `rgba(var(--color-${variables.entity_5.color}), 1)`;]]]"
                  img_cell:
                    - background-color: "[[[ return `rgba(var(--color-${variables.entity_5.color}), 0.20)`;]]]"
                  card:
                    - box-shadow: "none"
                    - border-radius: "none"
                    - width: "auto"
                    - padding: "5px"
                # + " KWh"
                label: |
                  [[[
                          return states[variables.entity_5.entity_id].state;
                  ]]]
            item3:
              card:
                type: "custom:button-card"
                tap_action:
                  action: "more-info"
                entity: "[[[ return variables.entity_6.entity_id ]]]"
                name: "[[[ return variables.entity_6.name ]]]"
                icon: "[[[ return variables.entity_6.icon ]]]"
                template:
                  - "icon_info_bg"
                #variables:
                #  ulm_card_generic_swap_name: "[[[ return variables.entity_5.name ]]]"
                #  ulm_card_generic_swap_icon: "[[[ return variables.entity_5.icon ]]]"
                styles:
                  icon:
                    - color: "[[[ return `rgba(var(--color-${variables.entity_6.color}), 1)`;]]]"
                  img_cell:
                    - background-color: "[[[ return `rgba(var(--color-${variables.entity_6.color}), 0.20)`;]]]"
                  card:
                    - box-shadow: "none"
                    - border-radius: "none"
                    - width: "auto"
                    - padding: "5px"
                label: |
                  [[[
                          return states[variables.entity_6.entity_id].state * 0.001 + " KVa";
                  ]]]
    radial:
      card:
        type: custom:apexcharts-card
        graph_span: 7d
        span:
          start: day
          offset: '-7d'
        header:
          show: true
          title: Consommations des 7 derniers jours
          show_states: true
          colorize_states: true
        series:
          - entity: sensor.myelectricaldata_consumption_xxx
            yaxis_id: gauche
            name: Conso
            unit: kWh
            color: deepskyblue
            type: column
            group_by:
              duration: 1d
              func: max
            opacity: 0.8
            stroke_width: 4
            show:
              datalabels: true
            data_generator: >
              return entity.attributes.dailyweek.map((dailyweek, index) =>
              {
                        return [new Date(dailyweek).getTime(), entity.attributes.daily[index]];
                      });
          - entity: sensor.myelectricaldata_consumption_xxx
            yaxis_id: droite
            name: Coût
            unit: €
            color: orange
            type: line
            group_by:
              duration: 1d
              func: max
            opacity: 0.8
            stroke_width: 4
            show:
              datalabels: true
            data_generator: >
              return entity.attributes.dailyweek.map((dailyweek, index) =>
              {
                        return [new Date(dailyweek).getTime(), entity.attributes.dailyweek_cost[index]];
                      });
          - entity: sensor.myelectricaldata_consumption_xxx
            yaxis_id: droite
            name: Puissance Max
            unit: KvA
            color: red
            type: line
            group_by:
              duration: 1d
              func: max
            opacity: 0.8
            stroke_width: 2
            show:
              datalabels: true
            data_generator: >
              return entity.attributes.dailyweek.map((dailyweek, index) =>
              {
                        return [new Date(dailyweek).getTime(), entity.attributes.dailyweek_MP[index]];
                      });
        apex_config:
          xaxis:
            labels:
              show: true
          yaxis:
            - id: gauche
              min: 0
              max: 100
              opposite: false
              labels:
                show: true
            - id: droite
              min: 0
              max: 15
              opposite: true
              labels:
                show: true
          legend:
            show: false
Merci pour ce que tu fais.
Dans ton template tu fais appel a un autre template ulm_translation engine. je pense que ça vient de là non?
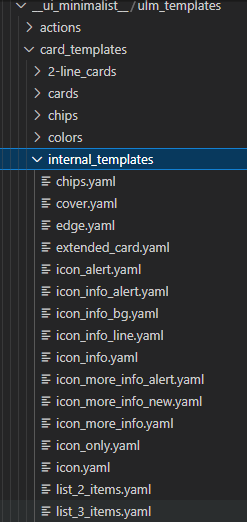
les ulm_* sont intégrés par défaut dans le cadre de minimalist. L’erreur que je lis me fait plus penser au fait qu’il manque un autre template qui normalement fait partie de minimalist (affichage de 3 items sur une ligne) pour créer cela:
Voilà c’est déjà mieux. Il me manque la coloration des icones.
Top !! c’est encore caché qque part dans le theme minimaliste… mais là je ne sais pas t’aider. Pour mushroom c facile, faut installer le theme et le sélectionner mais là faut le/les retrouver ^^
J’essai de faire le graph sur la production que me retourne enedis mais ça reste a zero avec le sensor associé a la prod.
type: custom:apexcharts-card
graph_span: 7d
span:
  start: day
  offset: '-7d'
header:
  show: true
  title: Production des 7 derniers jours
  show_states: true
  colorize_states: true
series:
  - entity: sensor.myelectricaldata_production_12478726430943
    yaxis_id: gauche
    name: Puissance Max
    unit: KWh
    color: green
    type: column
    group_by:
      duration: 1d
      func: max
    opacity: 0.8
    stroke_width: 4
    show:
      datalabels: true
    data_generator: |
      return entity.attributes.dailyweek.map((dailyweek, index) => {
                return [new Date(dailyweek).getTime(), entity.attributes.dailyweek_MP[index]];
              });
apex_config:
  xaxis:
    labels:
      show: true
  yaxis:
    - id: gauche
      forceNiceScale: true
      max: |
        EVAL: function(max) { return max }
      opposite: false
      labels:
        show: false
    - id: droite
      forceNiceScale: true
      max: |
        EVAL: function(max) { return max }
      opposite: true
      labels:
        show: false
  legend:
    show: false
  chart:
    column: true
J’ai retiré :
    data_generator: |
      return entity.attributes.dailyweek.map((dailyweek, index) => {
                return [new Date(dailyweek).getTime(), entity.attributes.dailyweek_MP[index]];
              });
et c’est ok
cob94440:
dailyweek_MP
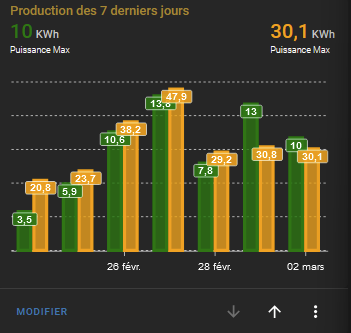
cela te retroune le Max Power utilisé et donc pas nécéssaire en mode production. Il faut prendre daily et tu auras :
Voilà ce que j’ai mis. En revanche il ne garde pas l’échelle pour comparer je vais creuser apex
type: custom:apexcharts-card
graph_span: 7d
span:
  start: day
  offset: '-7d'
header:
  show: true
  title: Production des 7 derniers jours
  show_states: true
  colorize_states: true
series:
  - entity: sensor.myelectricaldata_production_12478726430943
    yaxis_id: gauche
    name: Puissance Max
    unit: KWh
    color: green
    type: column
    group_by:
      duration: 1d
      func: max
    opacity: 0.8
    stroke_width: 4
    show:
      datalabels: true
    data_generator: |
      return entity.attributes.dailyweek.map((daily, index) => {
                return [new Date(daily).getTime(), entity.attributes.daily[index]];
              });
  - entity: sensor.myelectricaldata_consumption_12462373340635
    yaxis_id: gauche
    name: Puissance Max
    unit: KWh
    color: orange
    type: column
    group_by:
      duration: 1d
      func: max
    opacity: 0.8
    stroke_width: 4
    show:
      datalabels: true
    data_generator: |
      return entity.attributes.dailyweek.map((daily, index) => {
                return [new Date(daily).getTime(), entity.attributes.daily[index]];
              });
apex_config:
  xaxis:
    labels:
      show: true
  yaxis:
    - id: gauche
      forceNiceScale: true
      max: |
        EVAL: function(max) { return max }
      opposite: false
      labels:
        show: false
    - id: droite
      forceNiceScale: true
      max: |
        EVAL: function(max) { return max }
      opposite: true
      labels:
        show: false
  legend:
    show: false
  chart:
    column: true
Edit: trouvé comme ceci :
apex_config:
  xaxis:
    labels:
      show: true
  yaxis:
    - id: gauche
      min: 0
      max: 60
      opposite: false
      labels:
        show: false
    - id: droite
      min: 0
      max: 60
      opposite: true
      labels:
        show: false
  legend:
    show: false
  chart:
    column: true
Hello
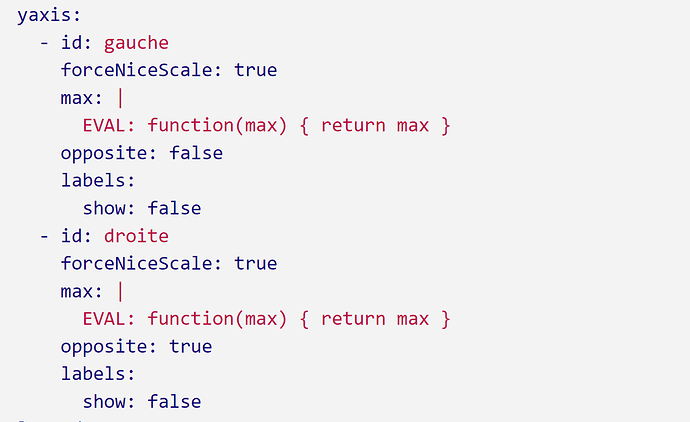
tu peux carément enlever la partie - id: droite et tout ce qu’ily a en dessous 'c’est plus si tu veux afficher une autre data sur une autre echelle etc… Tu peux aussi enlever max: comme cela l’échelle basculera en mode auto
Bonsoir ,
Salut,
Expliques plus en détails ce que tu veux et comment tu le veux.
Hello,
La base de départ de ce post se base sur les HP/HC. Tu souhaites faire quoi spécifiquement ?
![]()
