Bonsoir à tous,
je cherche à adapter un peu les mini graph sur ma page des températures
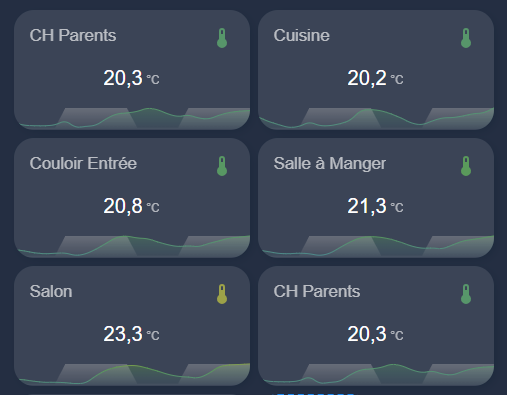
Pour le moment j’ai ceci visuellement :
Le code utilisé est le suivant :
type: custom:mini-graph-card
entities:
  - entity: sensor.temp_ch_parents_temperature
    name: Température
    show_state: true
    show_line: true
  - entity: binary_sensor.jour
    name: Jour/Nuit
    color: "#B3B3B3"
    y_axis: secondary
    smoothing: false
    aggregate_func: min
    show_state: false
    show_line: false
    show_points: false
color_thresholds:
  - value: 15
    color: "#4682b4"
  - value: 22
    color: "#5d9d52"
  - value: 25
    color: "#f3a93c"
  - value: 30
    color: "#cb4f40"
height: 50
decimals: 1
font_size: 60
hour24: true
name: CH Parents
hours_to_show: 48
point_per_hour: 1
line_width: 2
smoothing: fa
show:
  fill: fade
  graph: line
  icon: true
  name: true
  state: true
  labels: false
  labels_secondary: false
  extrema: false
  average: false
  icon_adaptive_color: true
  legend: false
state_map:
  - value: "off"
    label: Nuit
  - value: "on"
    label: Jour
align_icon: right
align_state: center
card_mod:
  style: |
    .info.flex {
      margin-top: -60px;
    }
    .graph__legend__item:nth-child(-n+2) {
      flex-basis: 40%;
      justify-content: center
    }
grid_options:
  columns: 6
  rows: 2
Un première adaptation a été de faire en sorte que le symbole change de couleur en fonction de la valeur de l’entité température.
J’ai aussi modifié la couleur de la valeur numérique en fonction de la température de la pièce
avec ceci :
Couleur de la valeur numérique en fonction de la température
.states.flex {
      {% if states('sensor.temp_ch_parents_temperature') <= '15' %}
      color: #4682b4
      {% elif states('sensor.temp_ch_parents_temperature') <= '22' %}
      color: #5d9d52;
      {% elif states('sensor.temp_ch_parents_temperature') <= '25' %}
      color: #f3a93c;
      {% elif states('sensor.temp_ch_parents_temperature') <= '30' %}
      color: #cb4f40;
      {% endif %}
      margin-top: -20px; /* Monte la température légèrement */
    }
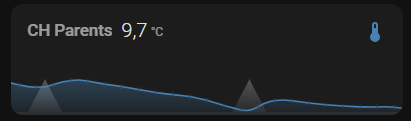
Ce que j’aimerais faire maintenant, sans changer la taille de la carte au global :
- Afficher la valeur numérique un peu plus haut pour laisser de la place à la courbe
- Augmenter l’espace d’affichage de la courbe pour mieux la voir
Je n’ai pas trouver encore comment faire sans agrandir la carte 
Merci de votre aide et coup de pouce sur le sujet
Salut,
pour la première demande.
card_mod:
  style: |
    ha-card > div.states.flex > div.state.false {
      margin-top: -42px;
      margin-left: -130px;
    }
Pour la deuxième pas trouver, je cherche.
essaye un des trucs la dedans
                card_mod:
                  style: |
                    .states--secondary {
                       font-size: 5px;
                         }
                     ha-card .header.flex .name.flex {
                       margin-top: -15px;
                       font-size: 12px;
                       margin-left: -10px;
                       }
                     ha-card .states.flex {
                       margin-top: -18px;
                       margin-left: -10px;
                       margin-right: -10px;
                       font-weight: bold;
                       font-size: 6px;
                       }
                     ha-card .graph .graph__container {
                       margin-top: -15px;
                       }
                     ha-card .graph .graph__container .graph__labels span {
                       color: #ff7800;
                       background-color: transparent;

                       font-size: 80%;
                       }
                     ha-card .header.flex .icon {
                       --mdc-icon-size: 5px;
                       margin-top: -11px;
                       color: #959595;
                       }
Bonjour,
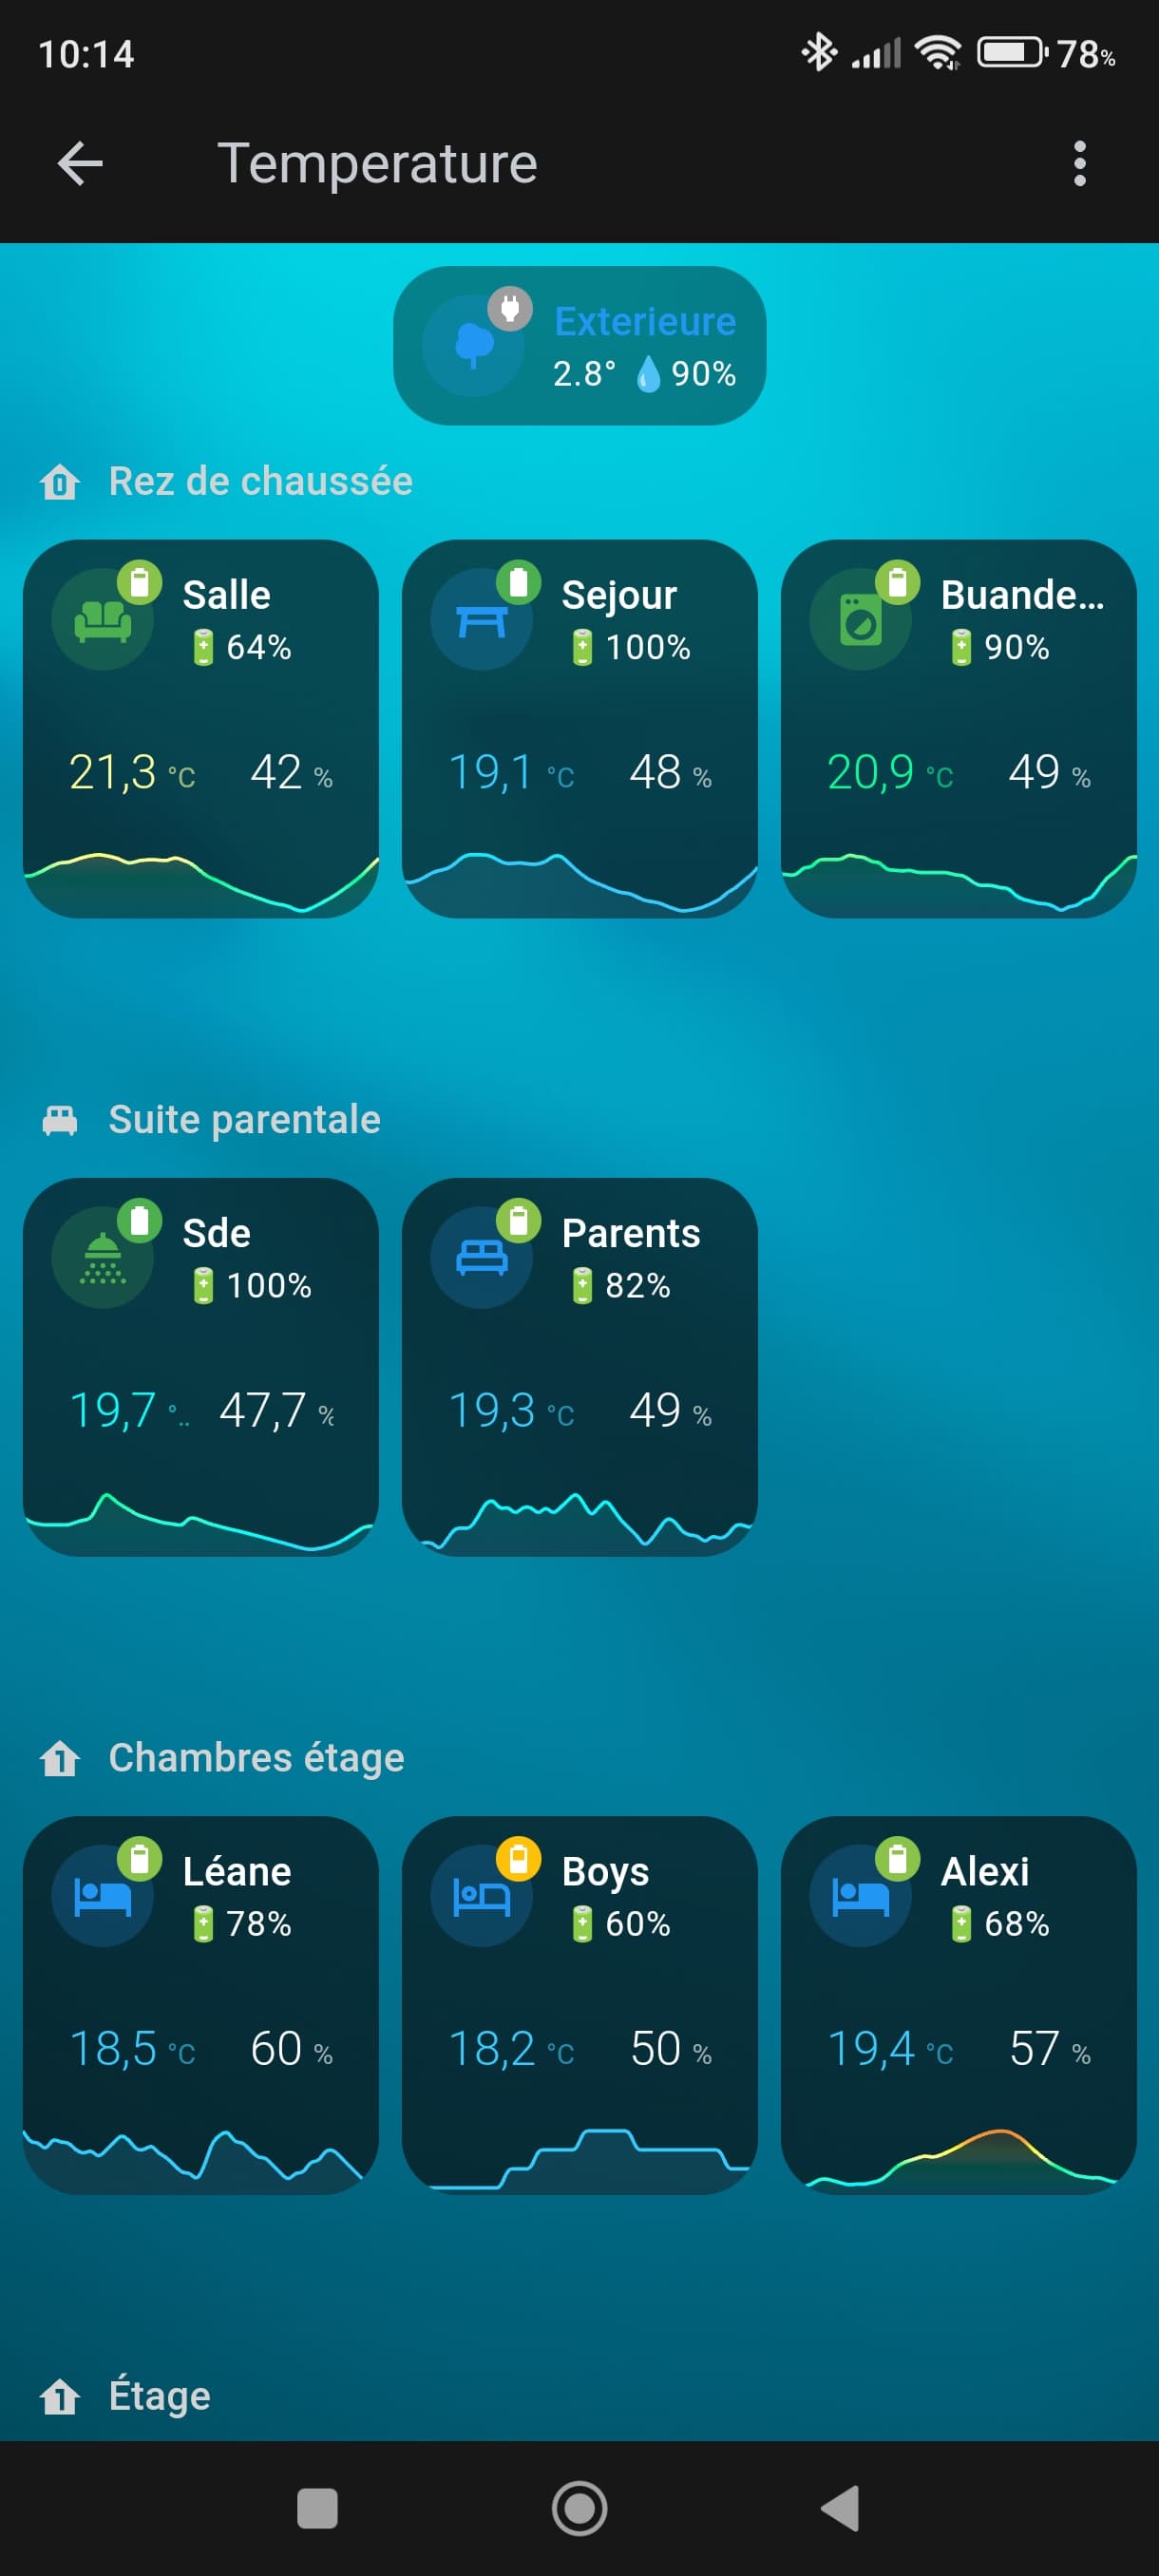
C’est marrant, j’ai passé une partie de ma journée de hier à faire quasi la même chose pour avoir une vue équilibrée entre mon smartphone et ma tablette murale.
Mais je cherche à le faire sans card_mod.
J’ai le même problème que toi de hauteur du graphe, j’aurais aimé avoir les labels min et maxi, mais ça bug en vue section.
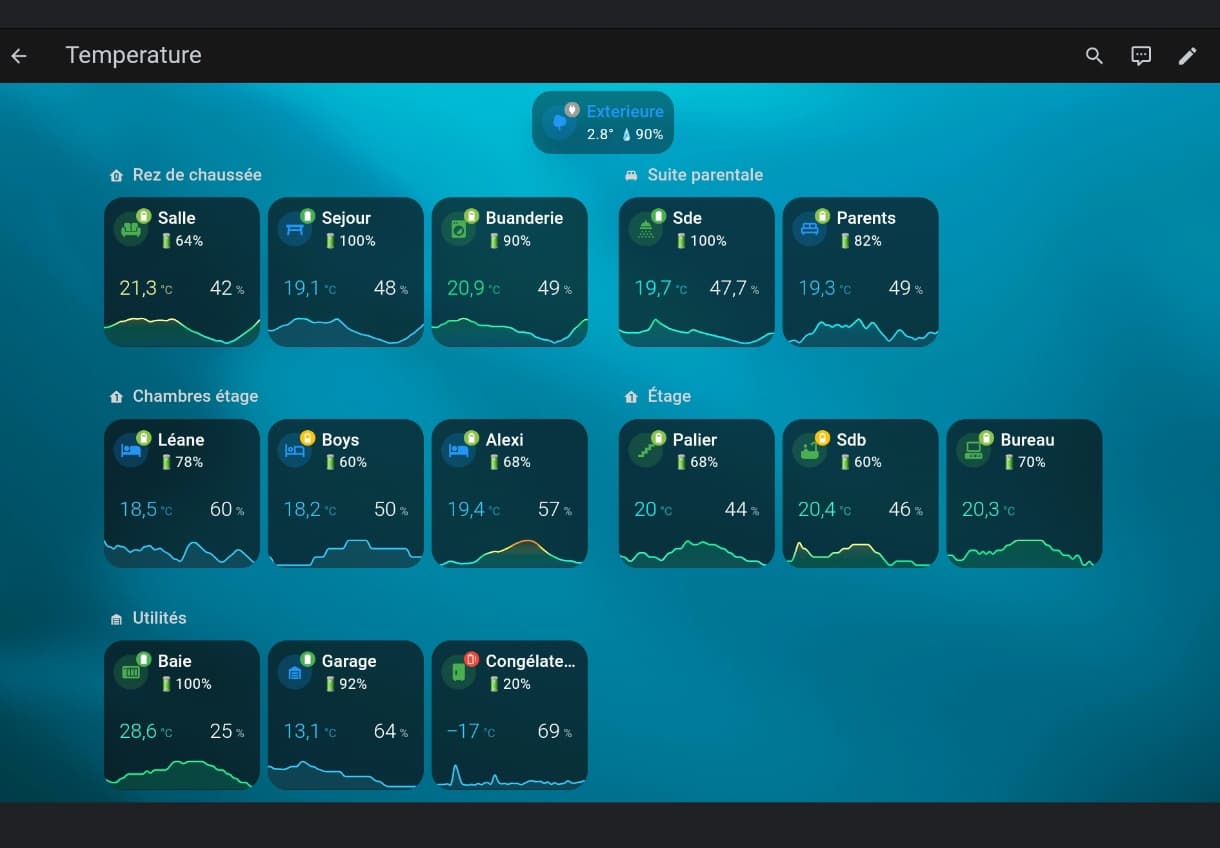
Pour ma part j’affiche température, humidité et niveau de batterie des sondes.
Voici mes vues pour partager :
Vue smartphone
Vue tablette
Code une card
type: custom:vertical-stack-in-card
cards:
  - type: custom:mushroom-template-card
    primary: "Salle "
    secondary: 🔋{{ states('sensor.sonde_salle_battery') | round(0)}}%
    icon: mdi:sofa
    icon_color: |-
      {% set state = states('sensor.sonde_salle_temperature') %}
      {% if is_number(state) and state | float > 26 %}
      red
      {% elif is_number(state) and state | float > 23 %}
      yellow
      {% elif is_number(state) and state | float > 19.5 %}
      green
      {% else %}
      blue
      {% endif %}
    badge_icon: |-
      {% set battery_level = states('sensor.sonde_salle_battery') | int %}
      {% if is_number(battery_level) and battery_level | float > 90 %}
      mdi:battery
      {% elif is_number(battery_level) and battery_level | float > 60 %}
      mdi:battery-80
      {% elif is_number(battery_level) and battery_level | float > 30 %}
      mdi:battery-50
      {% elif is_number(battery_level) and battery_level | float > 20 %}
      mdi:battery-30
      {% elif is_number(battery_level) and battery_level | float > 10 %}
      mdi:battery-alert-variant-outline
      {% else %}
      mdi:power-plug
      {% endif %}
    badge_color: |-
      {% set battery_level = states('sensor.sonde_salle_battery') | int %}
      {% if is_number(battery_level) and battery_level | float > 90 %}
      green
      {% elif is_number(battery_level) and battery_level | float > 60 %}
      light-green
      {% elif is_number(battery_level) and battery_level | float > 30 %}
      amber
      {% elif is_number(battery_level) and battery_level | float > 20 %}
      orange
      {% elif is_number(battery_level) and battery_level | float > 10 %}
      red
      {% else %}
      grey
      {% endif %}
  - type: custom:mini-graph-card
    entities:
      - entity: sensor.sonde_salle_temperature
        name: Température
        state_adaptive_color: true
      - entity: sensor.sonde_salle_humidity
        name: Humidité
        show_state: true
        y_axis: secondary
        show_line: false
        show_graph: false
        color: white
    hour24: true
    hours_to_show: 24
    points_per_hour: 2
    font_size: 50
    show:
      name: false
      icon: false
      legend: false
      labels: false
      extrema: false
    color_thresholds:
      - color: "#33ccff"
        value: 19
      - color: "#00ffff"
        value: 19.5
      - color: "#33ffcc"
        value: 20
      - color: "#00ff99"
        value: 20.5
      - color: "#ffff99"
        value: 21
      - color: "#ffff33"
        value: 21.5
      - color: "#ff9933"
        value: 22
      - color: "#cc6633"
        value: 24
      - color: "#ff6000"
        value: 26
Bonsoir à tous
Désolé pour ma réponse tardive pas dispo ces derniers jours !
J’ai régardé ce que vous avez proposé qui est fort intéressant.
@Jeffodilo top tes cartes mais je les trouve un peu grande pour le nombre de capteur que j’ai aujourd’hui 
@WarC0zes et @Plouf34 , j’ai mixé un peu de ce que vous avez proposé 
En tout cas merci à tous les 3
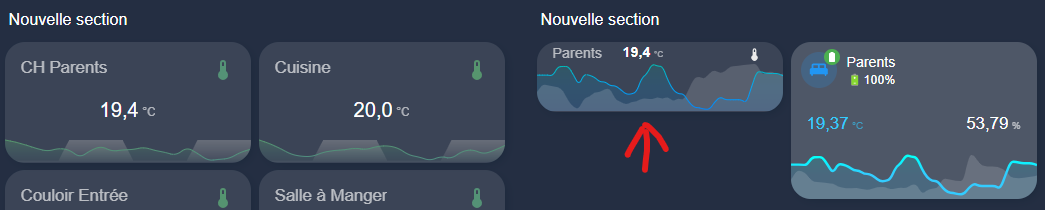
Le résultat de tout ça au bout de la flèche rouge il faut encore adapter un peu mais l’idée se profile tout de même
à gauche : ma carte d’origine
au milieu : un début d’adaptation
à droite : ta carte @Jeffodilo
2 « J'aime »