cette carte n’est pas de moi, j’ai trouver le code que j’ai modifier au mieux.
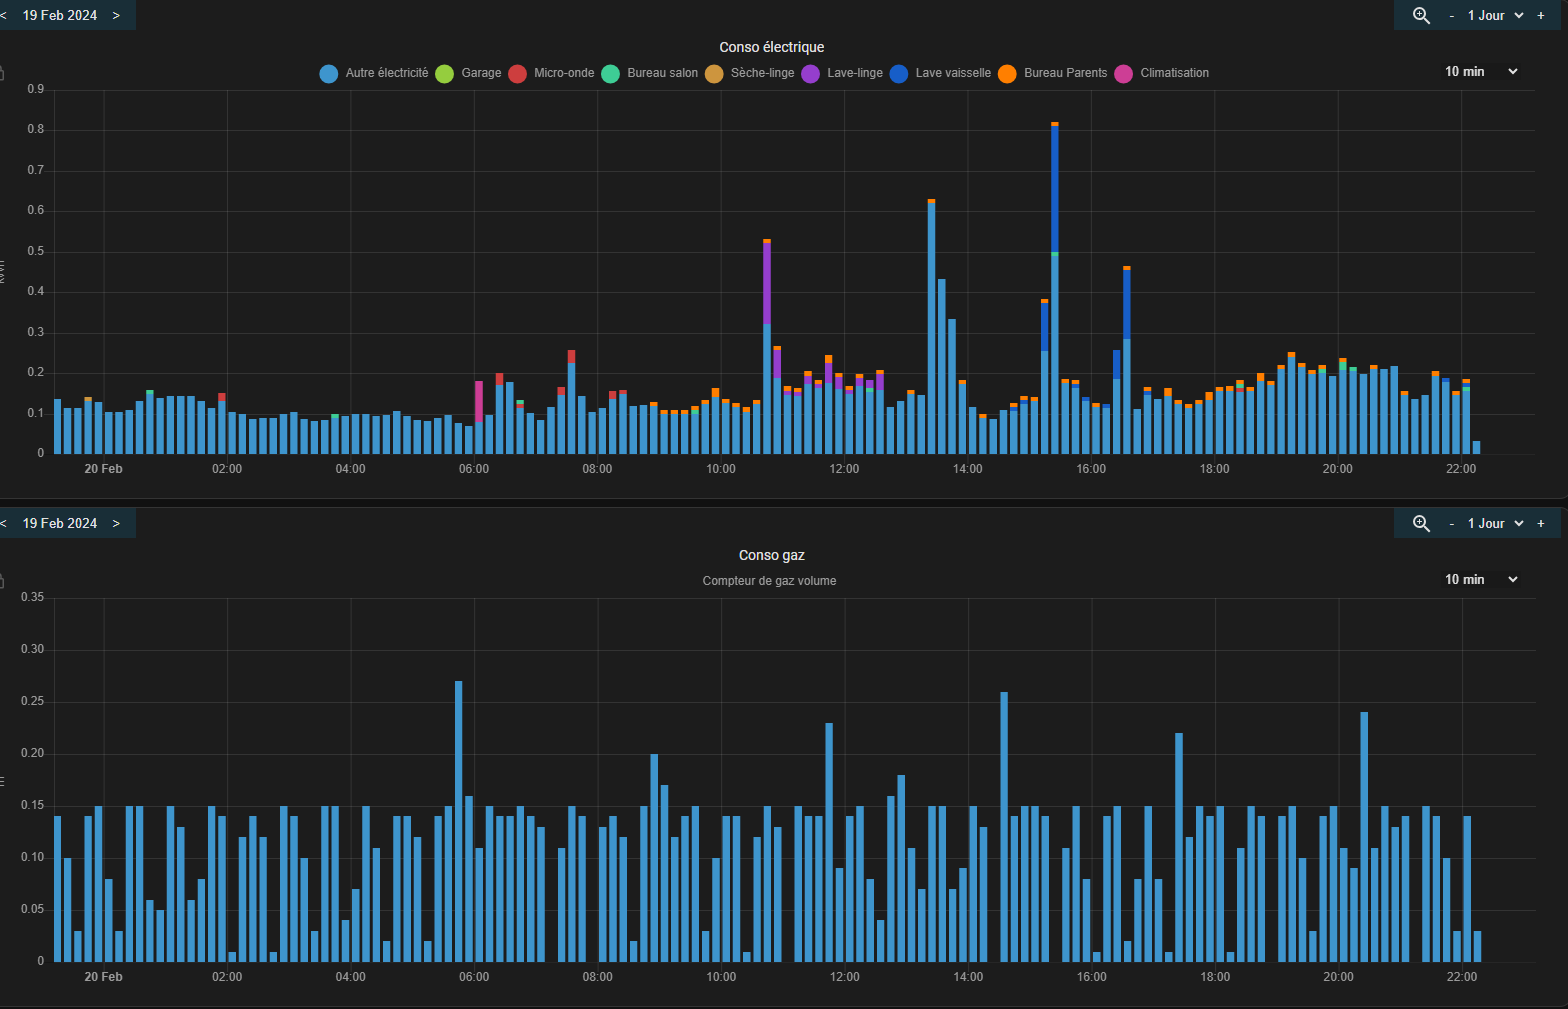
dans la colonne de droite seule la conso du jour est affichée, sur les jour précédents il faut pointer sur le graph pour voir la valeur .
Dans 2mqtt, consol dev voila une procédure pour remettre a zéro le compteur Energie de la prise, il y a une solution pour que tous les jours a une certaine heure il se remette a zéro afin que je puisse avoir une valeur journalière , le mieux serait de récupérer la valeur autre part mais je ne trouve pas
==> Endpoint : 1 Cluster : 0x00 Command : 0 Payload : (ne modifiez pas cela)
Si quelqu’un a la solution pour que la valeur change également dans la colonne de droite je suis preneur.
voila le code
type: custom:plotly-graph
hours_to_show: 12
time_offset: 5m
autorange_after_scroll: true
config:
  displaylogo: false
  scrollZoom: true
  displayModeBar: true
entities:
  - entity: sensor.sebastien_iezzi_daily_yield
    mode: lines+markers+text
    textposition: top right
    textfont:
      color: rgba ( 0, 221, 51 , 1)
      size: 2
    marker:
      size: 2
      color: rgba(  0, 221, 51  , 1)
    showlegend: true
    hovertemplate: >-
      <span style="text-align: center; font-size: 20px;">%{y:.1f}
      KW</span><br>%{x}<extra></extra>
    texttemplate: ' %{y:.0f}'
    yaxis: y1
    name: SMA
    line:
      width: 2
      color: rgba ( 0, 221, 51   , 1)
  - entity: sensor.prise_boiler_energy
    legendgroup: 2
    showlegend: true
    mode: lines
    hovertemplate: >-
      <span style="text-align: center; font-size: 20px;">%{y:.1f}
      KW</span><br>%{x}<extra></extra>
    texttemplate: ' %{y:.1f}'
    yaxis: y1
    marker:
      size: 2
      color: rgba(   225, 255, 0   ,.2)
    name: EAU
    line:
      shape: spline
      width: 2
      color: rgba (  225, 255, 0   , 1)
  - entity: sensor.machine_a_cafe_mss315_energy_kwh_main_channel
    showlegend: true
    mode: lines
    hovertemplate: >-
      <span style="text-align: center; font-size: 20px;">%{y:.1f}
      KW</span><br>%{x}<extra></extra>
    texttemplate: ' %{y:.1f}'
    yaxis: y1
    marker:
      size: 20
      color: rgba(165,165,0,0.9)
    name: CAFE
    line:
      shape: spline
      width: 3
      color: ' #ffab3b '
  - entity: sensor.seba_sabri_consommation_d_energie
    showlegend: true
    hovertemplate: >-
      <span style="text-align: center; font-size: 20px;">%{y:.1f}
      KW</span><br>%{x}<extra></extra>
    yaxis: y1
    textposition: bottom left
    texttemplate: ' %{y:.1f}'
    name: SE-SA
    line:
      width: 3
      shape: spline
      color: rgba ( 249, 37, 8, 0.8)
  - entity: sensor.anthony_consommation_d_energie
    showlegend: true
    hovertemplate: >-
      <span style="text-align: center; font-size: 20px;">%{y:.1f}
      KW</span><br>%{x}<extra></extra>
    yaxis: y1
    name: ANTHO
    texttemplate: ' %{y:.1f}'
    line:
      shape: spline
      width: 3
      color: rgba (   0, 201, 255  , 0.9)
  - entity: sensor.alissia_consommation_d_energie
    showlegend: true
    hovertemplate: >-
      <span style="text-align: center; font-size: 20px;">%{y:.1f}
      KW</span><br>%{x}<extra></extra>
    yaxis: y1
    name: ALISSIA
    texttemplate: ' %{y:.1f}'
    line:
      shape: spline
      width: 3
      color: rgba (  0, 111, 255 , 0.9)
  - entity: ''
    hovertemplate: '<span style="display: none;"> <extra></extra>     '
    name: Now
    yaxis: y9
    texttemplate: ' Now'
    showlegend: false
    show_value: true
    line:
      width: 2
      color: rgba (   255,255,255 , 1 )
    x: $ex [Date.now(), Date.now()]
    'y':
      - 0
      - 1
defaults:
  entity:
    show_value: false
  yaxes:
    fixedrange: true
    rangemode: tozero
fn: |
  $fn({getFromConfig, vars})=> {
    const range = getFromConfig("visible_range");
    const width = range[1] - range[0];
    vars.scroll = (label, p) => ({
      args: [
        {
          layout: {
            "xaxis.range": [range[0] + width*p, range[1] + width*p],
          }
        }, {
          transition: {
            duration: 150,
          }
        }
      ],
      label,
      method: "animate",
    })
    vars.zoom = (label, h) => ({
      args: [
        {
          layout: {
            "xaxis.range": [Date.now()-1000*60*60*h, Date.now()],
          }
        }
      ],
      label,
      method: "animate",
    })
  }
layout:
  modebar:
    orientation: v
  marker:
    size: 20
  xaxis:
    tickangle: 0
    minor:
      nticks: 3
      tickmode: auto
      showgrid: false
      tickformat: auto
      gridcolor: '   #454545   '
  yaxis:
    side: left
    ticksuffix: null
    showticklabels: true
    tickangle: 0
    minor:
      nticks: 4
      tickmode: auto
      showgrid: true
      gridcolor: '   #454545   '
      tickformat: auto
    range:
      - 15
      - 35
  annotations:
    - text: |-
        $fn ({hass}) =>
          "<span style='font-size: 18px;'><span style='font-weight: bold; color: rgba( 0, 221, 51   , 1)'>"
          + hass.states['sensor.sebastien_iezzi_daily_yield'].state + "</span></span><br>"
          +  "</span><span style='font-weight: bold; font-size: 16px;color: rgba( 0, 221, 51   , 1)'>SMA kw</span><br>"
          + (hass.states['sensor.aire_acondicionado_temperature']  ? "<br><span style='font-size: 30px;color: rgba(  47, 255, 241    , 1)'>❄</span>":'')

      xref: x domain
      yref: y1 domain
      xanchor: center
      yanchor: top
      x: 1.08
      'y': 0.9
      showarrow: false
    - text: |-
        $fn ({hass}) =>
          "<span style='font-size: 18px;'><span style='font-weight: bold; color: rgba( 225, 255, 51   , 1)'>"
          + hass.states['sensor.prise_boiler_energy'].state + "</span></span><br>"
          +  "</span><span style='font-weight: bold; font-size: 16px;color: rgba( 225, 255, 51   , 1)'>EAU kw</span><br>"
          + (hass.states['sensor.aire_acondicionado_temperature']  ? "<br><span style='font-size: 30px;color: rgba(  47, 255, 241    , 1)'>❄</span>":'')

      xref: x domain
      yref: y1 domain
      xanchor: center
      yanchor: top
      x: 1.08
      'y': 0.75
      showarrow: false
    - text: |-
        $fn ({hass}) =>
          "<span style='font-size: 18px;'><span style='font-weight: bold; color: rgba(  255, 187, 47    , 1)'>"
          + hass.states['sensor.machine_a_cafe_mss315_energy_kwh_main_channel'].state + "</span></span><br>"
          +  "</span><span style='font-weight: bold; color: rgba( 255, 187, 47   , 1)'>CAFE kw</span><br>"
          + (hass.states['sensor.aire_acondicionado_temperature']  ? "<br><span style='font-size: 30px;color: rgba( 0, 221, 51   , 1)'></span>":'')

      xref: x domain
      yref: y1 domain
      xanchor: center
      yanchor: top
      x: 1.08
      'y': 0.6
      showarrow: false
    - text: |-
        $fn ({hass}) =>
          "<span style='font-size: 18px;'><span style='font-weight: bold; color: rgba(  249, 37, 8  , 1)'>"
          + hass.states['sensor.seba_sabri_consommation_d_energie'].state + "</span></span><br>"
          +  "</span><span style='font-weight: bold; color: rgba( 249, 37, 8   , 1)'>SS-kw</span><br>"
          + (hass.states['sensor.aire_acondicionado_temperature']  ? "<br><span style='font-size: 30px;color: rgba( 0, 221, 51   , 1)'></span>":'')

      xref: x domain
      yref: y1 domain
      xanchor: center
      yanchor: top
      x: 1.08
      'y': 0.45
      showarrow: false
    - text: |-
        $fn ({hass}) =>
          "<span style='font-size: 18px;'><span style='font-weight: bold; color: rgba(  0, 201, 255  , 1)'>"
          + hass.states['sensor.anthony_consommation_d_energie'].state + "</span></span><br>"
          +  "</span><span style='font-weight: bold; color: rgba( 0, 201, 255   , 1)'>AN-KW</span><br>"
          + (hass.states['sensor.aire_acondicionado_temperature']  ? "<br><span style='font-size: 30px;color: rgba( 0, 221, 51   , 1)'></span>":'')

      xref: x domain
      yref: y1 domain
      xanchor: center
      yanchor: top
      x: 1.08
      'y': 0.3
      showarrow: false
    - text: |-
        $fn ({hass}) =>
          "<span style='font-size: 18px;'><span style='font-weight: bold; color: rgba(  0, 111, 255  , 1)'>"
          + hass.states['sensor.alissia_consommation_d_energie'].state + "</span></span><br>"
          +  "</span><span style='font-weight: bold; color: rgba( 0, 111, 255   , 1)'>ALI-KW</span><br>"
          + (hass.states['sensor.aire_acondicionado_temperature']  ? "<br><span style='font-size: 30px;color: rgba( 0, 221, 51   , 1)'></span>":'')


      xref: x domain
      yref: y1 domain
      xanchor: center
      yanchor: top
      x: 1.08
      'y': 0.15
      showarrow: false
  yaxis2:
    side: left
    showticklabels: false
    title: ''
    tickangle: 0
    minor:
      nticks: 3
      tickmode: auto
      showgrid: true
      gridcolor: '   #454545   '
      tickformat: auto
  yaxis3:
    side: left
    showticklabels: false
    tickangle: 0
    minor:
      nticks: 3
      tickmode: auto
      showgrid: true
      gridcolor: '   #454545   '
      tickformat: auto
  yaxis4:
    side: left
    showticklabels: false
    tickangle: 0
    minor:
      nticks: 3
      tickmode: auto
      showgrid: true
      gridcolor: '   #454545   '
      tickformat: auto
  yaxis5:
    side: left
    showticklabels: false
    tickangle: 0
    minor:
      nticks: 3
      tickmode: auto
      showgrid: true
      gridcolor: '   #454545   '
      tickformat: auto
  height: 500
  margin:
    l: 40
    r: 60
    t: 100
  updatemenus:
    - buttons:
        - $fn({vars}) => vars.scroll( '<', -.5)
        - $fn({vars}) => vars.scroll( '>', .5)
      direction: right
      active: -1
      pad:
        r: 10
        t: -90
      type: buttons
      x: 1
      xanchor: right
      'y': 1
      yanchor: top
    - buttons:
        - $fn({vars}) => vars.zoom( '1M', 24*31)
        - $fn({vars}) => vars.zoom( '2w', 24*14)
        - $fn({vars}) => vars.zoom( '2d', 24*2)
        - $fn({vars}) => vars.zoom( '12h', 12)
        - $fn({vars}) => vars.zoom( '3h', 3)
        - $fn({vars}) => vars.zoom( '1h', 1)
      direction: right
      active: -1
      pad:
        l: -15
        t: -90
      type: buttons
      x: 0
      xanchor: left
      'y': 1
      yanchor: top
  font:
    family: Roboto,Noto,sans-serif
    size: 14
    color: $fn ({css_vars}) => css_vars['primary-text-color']
  paper_bgcolor: rgba(0, 0, 0, 0.4)
  plot_bgcolor: rgba(0, 0, 0, 0)