Avec la 2024.3 le tableau energy fera finalement ce que je cherchais à faire. ![]()
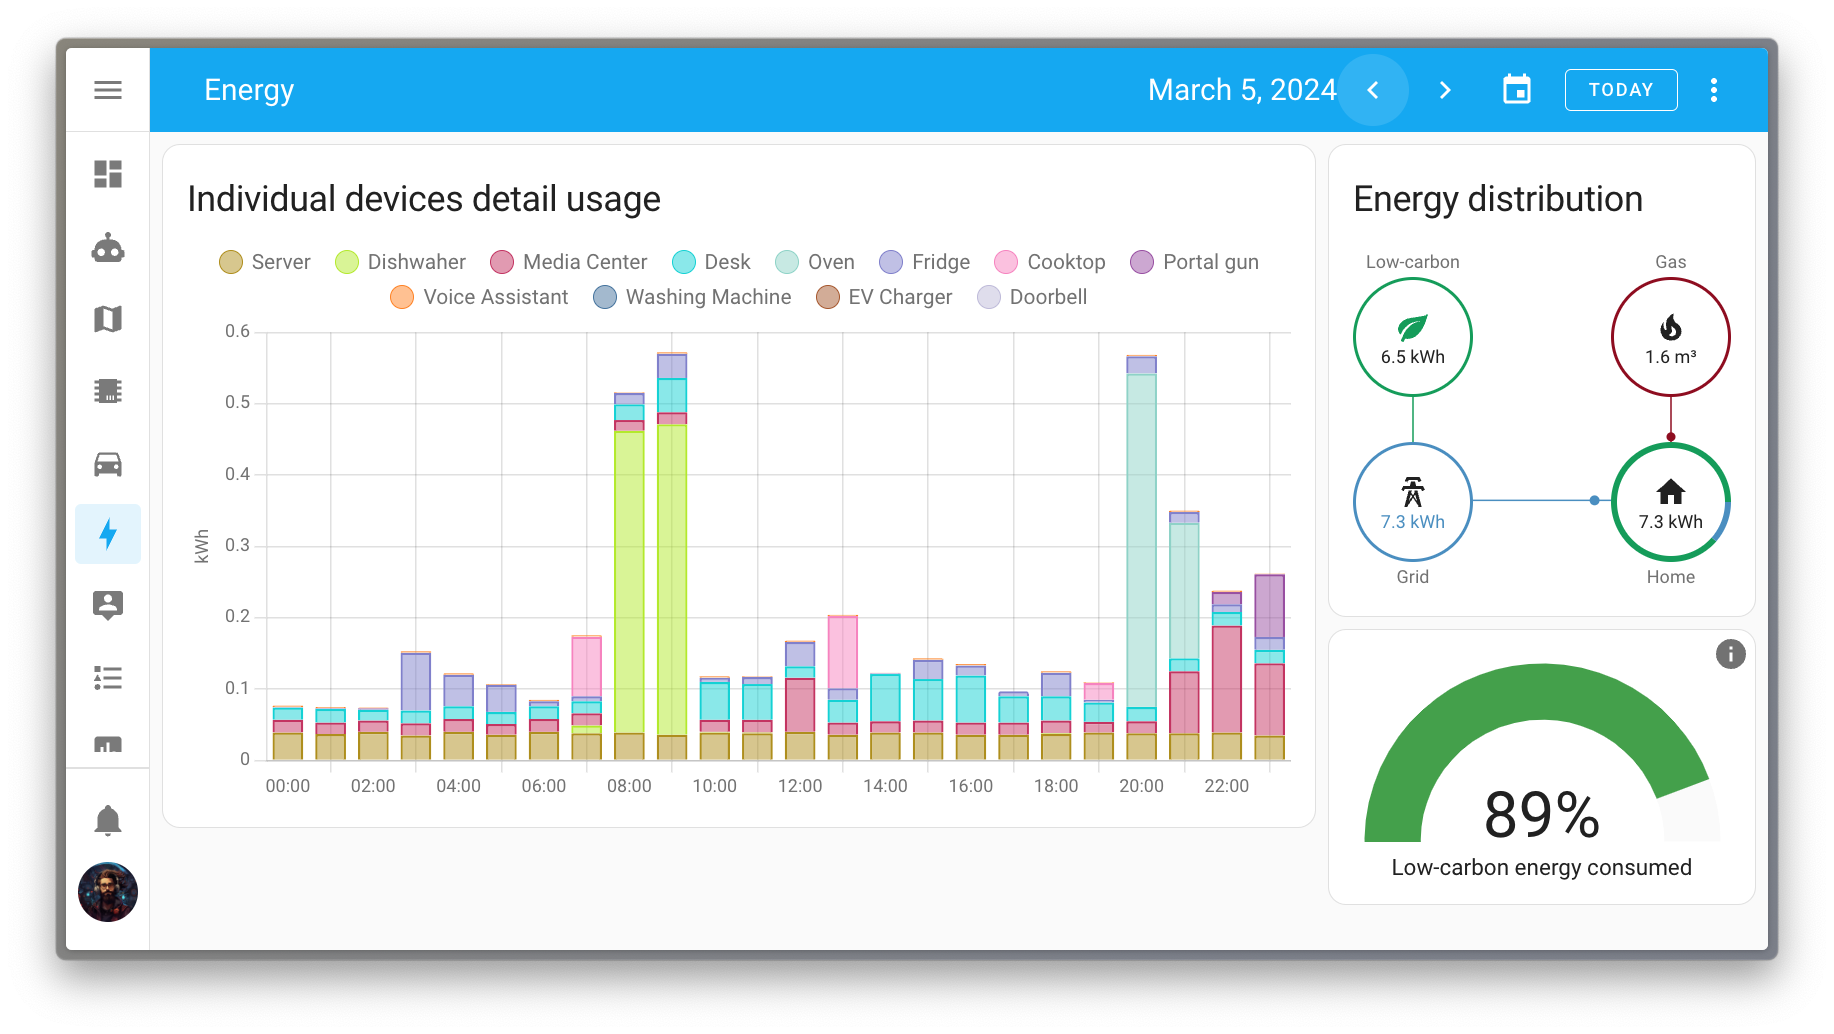
New energy graph for individual devices
Digging into your energy data is a very interesting way to find ways to reduce your household’s energy usage and environmental footprint.
One of the missing bricks was the ability to see the energy consumption of individual devices over time. Thanks to @karwosts, we have a brand new graph on the energy dashboard that provides this insight!
Using this new graph, you can now easily spot which devices are responsible for which part of your energy usage over time.