Hello à tous, je suis un newbie sur HA depuis cette semaine 
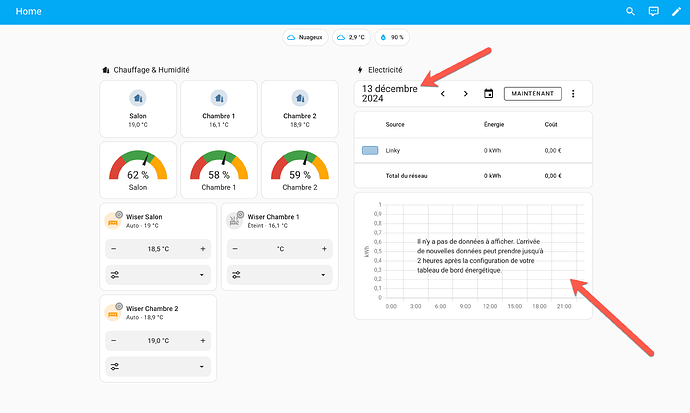
J’ai créé un tableau de bord custom sur lequel j’ajoute ma consommation électrique. Cette dernier vient du connexion avec mon compteur Linky et est rafraichi toutes les 24h.
Voici mon « problème » : par défaut, le graph se charge avec la data du jour, qui sont toujours vides donc. J’ai un date picker qui me permet de naviaguer, mais ça serait tellement plus simple qu’au chargement je puisse voir la conso élecrique J-1. Est-ce possible ? 
Bonjour,
non pas possible. Ça affiche toujours le jour en cours, comme dans le dashboard energie.
Arf c’est dommage ça ! Bon je vais prendre mon mal en patience 
Il te faut un Zlinky ou dans le genre, qui récupère ta consommation en cours. Passez par une intégration qui récupère chez enedis , tu auras toujours un décalage de 24h.
Une solution, pas parfaite mais mieux que rien, serait d’utiliser une autre carte comme GitHub - SpangleLabs/history-explorer-card: A card for Home Assistant Lovelace for exploring the history of your entities interactively and in real time. Sur cette carte, tu peux définir un « Time offset » qui te donne l’affichage de Jour-1:
Regarde cette section de la doc : GitHub - SpangleLabs/history-explorer-card: A card for Home Assistant Lovelace for exploring the history of your entities interactively and in real time.
Default view and time ranges
When the dashboard is opened, the card will show the last 24 hours by default. You can select a different default time range in the YAML. Use m, h, d, and w to denote minutes, hours, days and weeks respectively. For longer time scale, o and y denote months and year. Currently the maximum range is one year. If no postfix is given, hours are assumed.

type: custom:history-explorer-card
defaultTimeRange: 4h     # show the last 4 hours when opening the card
defaultTimeRange: 2d     # or 2 days...
defaultTimeRange: 15m    # or 15 minutes...
defaultTimeRange: 3w     # or 3 weeks
defaultTimeRange: 6o     # or 6 months
defaultTimeRange: 1y     # or 1 year
By default the card will open the graphs with the current date and time aligned to the right of the chart. You can define a custom time offset using the defaultTimeOffset setting which will be applied when you open the card or click the date button. Both relative time offsets (denoted by lower case time identifiers such as h,d,w,o,y) and offsets snapped to the current hour, day, month or year are supported. The latter will use upper case time identifiers H,D,O,Y. For example:

type: custom:history-explorer-card
defaultTimeOffset: 1h       # Add 1 hour of empty space after the current time
defaultTimeOffset: -1d      # Show the previous days' data
defaultTimeOffset: 1D       # Show the current day from midnight to midnight
defaultTimeOffset: 1O       # Show the entire current month, starting at the 1st
![]()
![]()
