Bonjour,
J’ai installé l’excellente intégration Versatile thermostat et tout fonctionne !
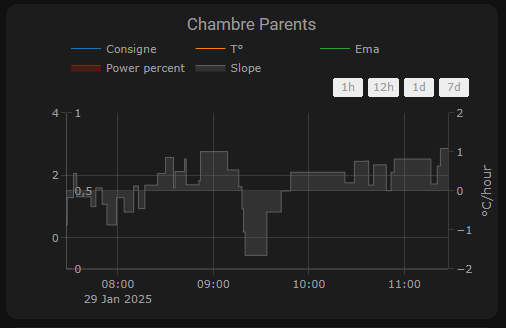
Néanmoins j’aimerais regardé de près le comportement en affichant un ploty-graph comme détaillé dans la notice et je n’ai pas les courbes de current_temperature, ema_temp, Power percent qui s’affichent. J’ai que le Slope qui s’affiche.
type: custom:plotly-graph
entities:
  - entity: climate.chambre_parents
    attribute: temperature
    yaxis: y1
    name: Consigne
  - entity: climate.chambre_parents
    attribute: current_temperature
    yaxis: y1
    name: T°
  - entity: climate.chambre_parents
    attribute: ema_temp
    yaxis: y1
    name: Ema
  - entity: climate.chambre_parents
    attribute: on_percent
    yaxis: y2
    name: Power percent
    fill: tozeroy
    fillcolor: rgba(200, 10, 10, 0.3)
    line:
      color: rgba(200, 10, 10, 0.9)
  - entity: sensor.chambre_parents_temperature_slope
    name: Slope
    fill: tozeroy
    yaxis: y9
    fillcolor: rgba(100, 100, 100, 0.3)
    line:
      color: rgba(100, 100, 100, 0.9)
hours_to_show: 4
refresh_interval: 10
height: 800
title: Chambre Parents
config:
  scrollZoom: true
layout:
  margin:
    r: 50
  legend:
    x: 0
    "y": 1.2
    groupclick: togglegroup
    title:
      side: top right
  yaxis:
    visible: true
    position: 0
  yaxis2:
    visible: true
    position: 0
    fixedrange: true
    range:
      - 0
      - 1
  yaxis9:
    visible: true
    fixedrange: false
    range:
      - -2
      - 2
    position: 1
  xaxis:
    rangeselector:
      "y": 1.1
      x: 0.7
      buttons:
        - count: 1
          step: hour
        - count: 12
          step: hour
        - count: 1
          step: day
        - count: 7
          step: day
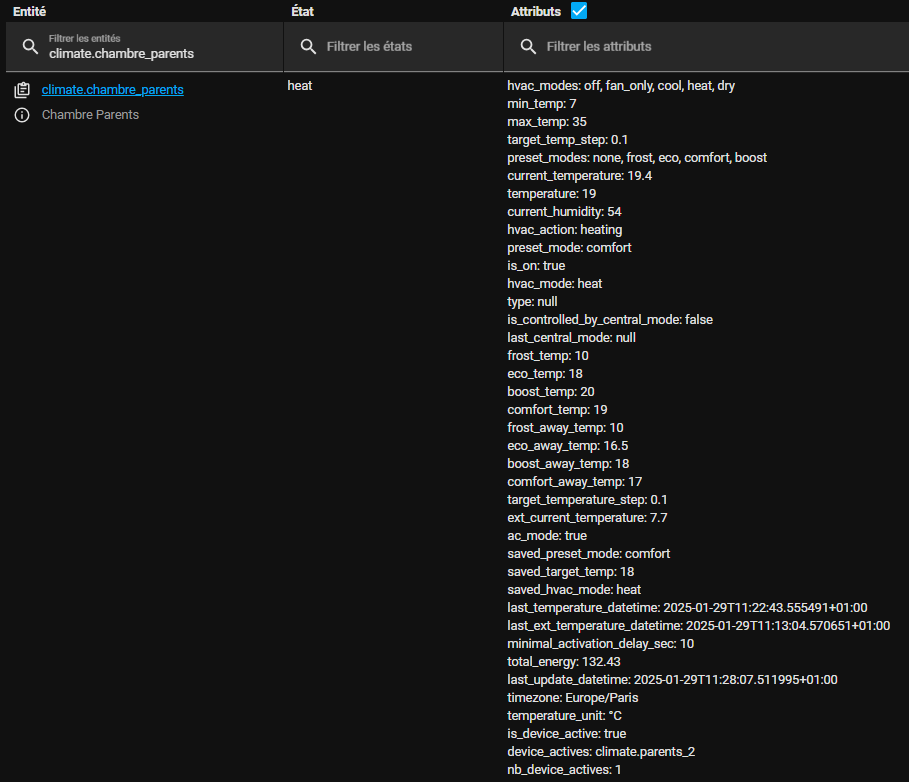
Les attributs semblent bien présent dans l’entité créée
Cela est valable sur tous mes radiateurs.
Merci pour vos retours.