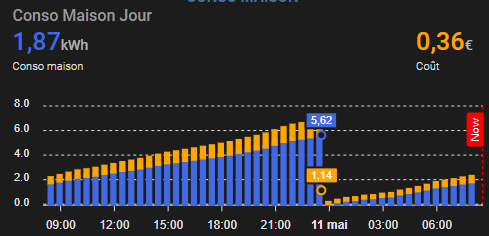
Un exemple de config:

  - type: custom:apexcharts-card
    graph_span: 1d
    stacked: true
    now:
      show: true
      color: red
      label: Now
    update_interval: 60sec
    header:
      show: true
      title: Conso Maison Jour
      show_states: true
      colorize_states: true
    apex_config:
      xaxis:
        tooltip:
          enabled: false
      chart:
        type: area
        height: 160px
      stroke:
        show: true
        width: 4
        curve: smooth
      legend:
        show: false
    series:
      - entity: sensor.energy_home_box_total_daily
        name: Conso maison
        unit: kWh
        transform: return x / 1000;
        float_precision: 2
        color: royalblue
        type: column
        opacity: 0.8
        group_by:
          func: max
          duration: 30min
        show:
          datalabels: false
          extremas: max
      - entity: sensor.energy_home_box_cout_daily
        name: Coût
        unit: €
        float_precision: 2
        color: orange
        type: column
        opacity: 0.8
        group_by:
          func: max
          duration: 30min
        show:
          datalabels: false
          extremas: max
Pour les barres essaye en rajoutant a chaque entité:
        group_by:
          func: max
          duration: 1m
et utilise l’option pour coller les barres entre elle:
stacked: true
Ta un sujet sur apexchart et des exemples de configuration pour aider [CARTE] Apexcharts-card