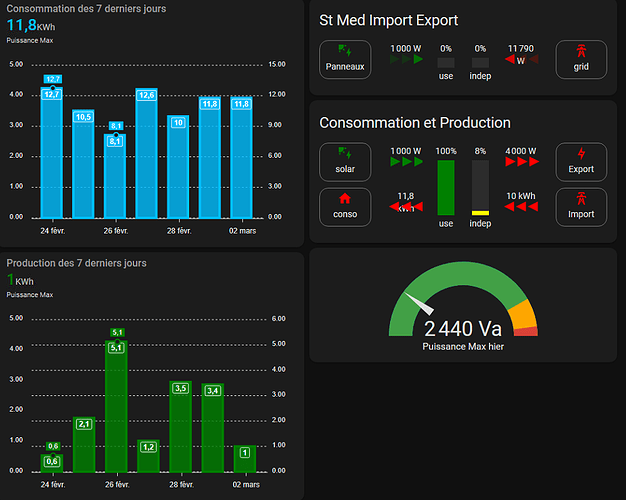
Hello,
Oui c’est pourquoi j’ai écrit un bout the code ^^

Voici le code que j’ai reutilisé et un tout petit peu adapté grâce à beaucoup d’entres vous (@Galadan, @ClassicRed etc…) - je reco aussi de regarder ce que fait @Galadan car c encore mieux ^^ ; et voici le code complet de cette fameuse carte pour @cob94440 :
Carte EDF
title: "EDF"
path: "edf"
cards:
  - type: horizontal-stack
    cards:
      - type: custom:mushroom-entity-card
        entity: sensor.myelectricaldata_last_update
        icon_type: icon
        name: EDF - Maj le
        tap_action:
          action: navigate
          navigation_path: /ui-lovelace-minimalist/home
        hold_action:
          action: none
        double_tap_action:
          action: none
        icon: mdi:keyboard-backspace
        icon_color: light-blue
        fill_container: false

  - type: vertical-stack
    cards:
      - type: custom:button-card
        template: "card_apexcharts_elec"
        variables:
          graph_span: "7d"
          entity_1:
            entity_id: "sensor.myelectricaldata_yesterday"
            icon: "mdi:flash"
            name: "Hier"
            color: "blue"
          entity_2:
            entity_id: "sensor.myelectricaldata_current_week"
            icon: "mdi:flash"
            name: "Semaine"
            color: "yellow"
          entity_3:
            entity_id: "sensor.myelectricaldata_current_month"
            icon: "mdi:flash"
            name: "Mois"
            color: "green"
          entity_4:
            entity_id: "sensor.myelectricaldata_current_year"
            icon: "mdi:flash"
            name: "Année"
            color: "pink"
          entity_5:
            entity_id: "sensor.myelectricaldata_subscribed_power"
            icon: "mdi:flash"
            name: "Puissance"
            color: "red"
          entity_6:
            entity_id: "sensor.myelectricaldata_yesterdayconsumptionmaxpower"
            icon: "mdi:flash"
            name: "P. Max hier"
            color: "purple"
      - type: custom:apexcharts-card
        graph_span: 7d
        span:
          start: day
          offset: "-7d"
        header:
          show: true
          title: Coûts des 7 derniers jours et résumé d'hier
          show_states: true
          colorize_states: true
        series:
          - entity: sensor.myelectricaldata_consumption_22325470269040
            yaxis_id: gauche
            name: Coût HP
            unit: €
            color: deepskyblue
            type: column
            group_by:
              duration: 1d
              func: max
            opacity: 0.8
            stroke_width: 4
            show:
              datalabels: true
            data_generator: >
              return entity.attributes.dailyweek.map((dailyweek, index) =>
              {
                        return [new Date(dailyweek).getTime(), entity.attributes.dailyweek_costHP[index]];
                      });
          - entity: sensor.myelectricaldata_consumption_22325470269040
            yaxis_id: gauche
            name: Coût HC
            unit: €
            color: orange
            type: column
            group_by:
              duration: 1d
              func: max
            opacity: 0.8
            stroke_width: 4
            show:
              datalabels: true
            data_generator: >
              return entity.attributes.dailyweek.map((dailyweek, index) =>
              {
                        return [new Date(dailyweek).getTime(), entity.attributes.dailyweek_costHC[index]];
                      });
          - entity: sensor.myelectricaldata_consumption_22325470269040
            yaxis_id: droite
            name: Coût total
            unit: €
            color: red
            type: line
            group_by:
              duration: 1d
              func: max
            opacity: 0.8
            stroke_width: 2
            show:
              datalabels: true
            data_generator: >
              return entity.attributes.dailyweek.map((dailyweek, index) =>
              {
                        return [new Date(dailyweek).getTime(), entity.attributes.dailyweek_cost[index]];
                      });
        apex_config:
          xaxis:
            labels:
              show: true
          yaxis:
            - id: gauche
              min: 0
              forceNiceScale: true
              max: 15 #|
#                EVAL: function(max) { return max }
              opposite: false
              labels:
                show: false
            - id: droite
              min: 0
              forceNiceScale: true
              max: 20 #|
#                EVAL: function(max) { return max }
              opposite: true
              labels:
                show: false
          legend:
            show: false
          chart:
            stacked: true
  # Conso
  - type: vertical-stack
    cards:
      - type: custom:apexcharts-card
        graph_span: 7d
        span:
          start: day
          offset: "-7d"
        header:
          show: true
          title: Conso des 7 derniers jours
          show_states: true
          colorize_states: true
        series:
          - entity: sensor.myelectricaldata_consumption_22325470269040
            yaxis_id: gauche
            name: Conso HP
            unit: KWh
            color: deepskyblue
            type: column
            group_by:
              duration: 1d
              func: max
            opacity: 0.8
            stroke_width: 4
            show:
              datalabels: true
            data_generator: >
              return entity.attributes.dailyweek.map((dailyweek, index) =>
              {
                        return [new Date(dailyweek).getTime(), entity.attributes.dailyweek_HP[index]];
                      });
          - entity: sensor.myelectricaldata_consumption_22325470269040
            yaxis_id: gauche
            name: Conso HC
            unit: KWh
            color: orange
            type: column
            group_by:
              duration: 1d
              func: max
            opacity: 0.8
            stroke_width: 4
            show:
              datalabels: true
            data_generator: >
              return entity.attributes.dailyweek.map((dailyweek, index) =>
              {
                        return [new Date(dailyweek).getTime(), entity.attributes.dailyweek_HC[index]];
                      });
          - entity: sensor.myelectricaldata_consumption_22325470269040
            yaxis_id: droite
            name: Conso totale
            unit: KWh
            color: red
            type: line
            group_by:
              duration: 1d
              func: max
            opacity: 0.8
            stroke_width: 2
            show:
              datalabels: true
            data_generator: >
              return entity.attributes.dailyweek.map((dailyweek, index) =>
              {
                        return [new Date(dailyweek).getTime(), entity.attributes.daily[index]];
                      });
        apex_config:
          xaxis:
            labels:
              show: true
          yaxis:
            - id: gauche
              min: 0
              forceNiceScale: true
              max: |
                EVAL: function(max) { return max }

              opposite: false
              labels:
                show: false
            - id: droite
              min: 0
              forceNiceScale: true
              max: |
                EVAL: function(max) { return max }

              opposite: true
              labels:
                show: false
          legend:
            show: false
          chart:
            stacked: true
  # PM
  - type: vertical-stack
    cards:
      - type: custom:apexcharts-card
        graph_span: 7d
        span:
          start: day
          offset: "-7d"
        header:
          show: true
          title: Puissance Max des 7 derniers jours
          show_states: true
          colorize_states: true
        series:
          - entity: sensor.myelectricaldata_consumption_22325470269040
            yaxis_id: gauche
            name: Puissance Max
            unit: KWh
            color: deepskyblue
            type: column
            group_by:
              duration: 1d
              func: max
            opacity: 0.8
            stroke_width: 4
            show:
              datalabels: true
            data_generator: >
              return entity.attributes.dailyweek.map((dailyweek, index) =>
              {
                        return [new Date(dailyweek).getTime(), entity.attributes.dailyweek_MP[index]];
                      });
        apex_config:
          xaxis:
            labels:
              show: true
          yaxis:
            - id: gauche
              #              min: 0
              forceNiceScale: true
              max: |
                EVAL: function(max) { return max }

              opposite: false
              labels:
                show: false
            - id: droite
              #              min: 0
              forceNiceScale: true
              max: |
                EVAL: function(max) { return max }

              opposite: true
              labels:
                show: false
          legend:
            show: false
          chart:
            column: true
PS: regardez ce fil pour intégrer votre production : c assez impressionant ^^
Je suis en train d’adapter cela pour uniquement s’appuyer sur Myelectricaldata et cela donne cela en alpha version :
