@Pyroaction
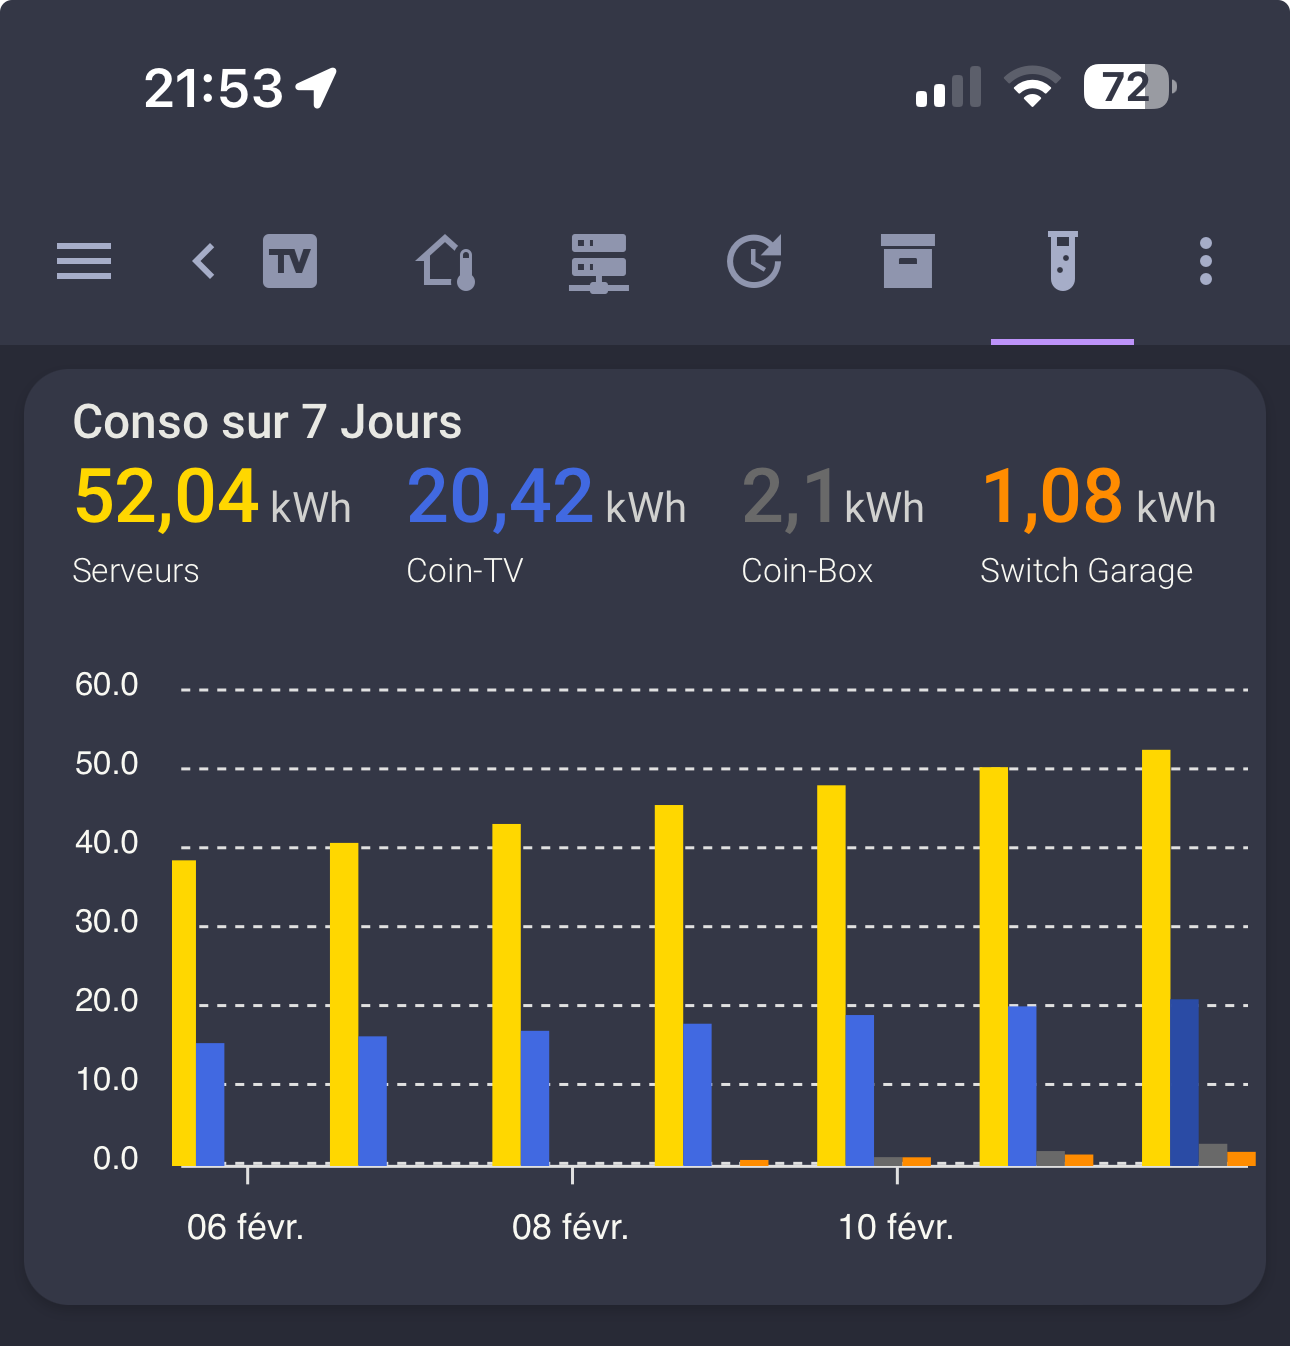
Ca y est, j’ai eu un peu de temps pour bricoler une carte comme la tienne 
Merci pour le coup de main avec ton code que j’ai du adapter un peu
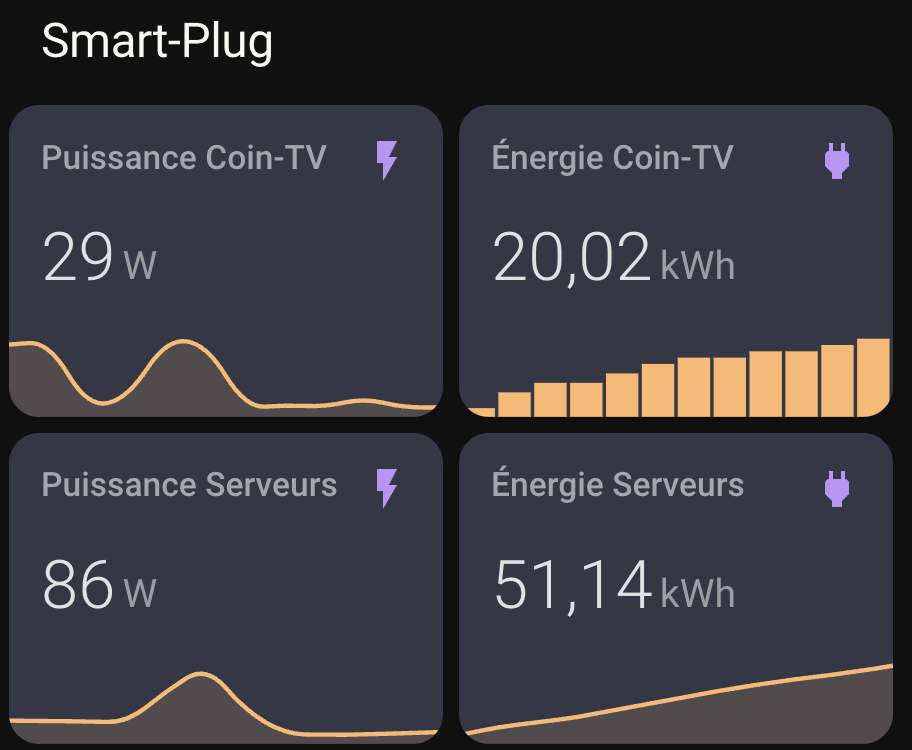
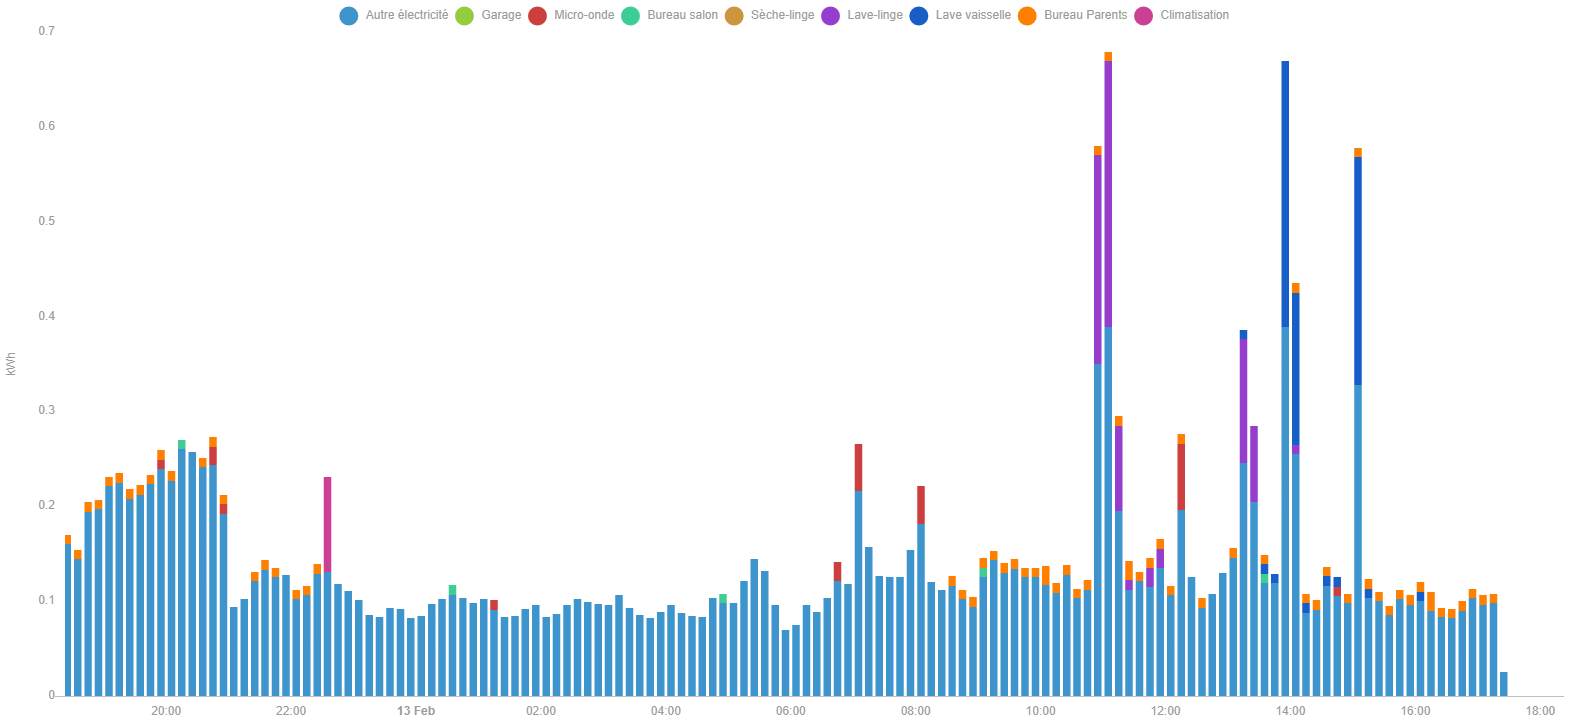
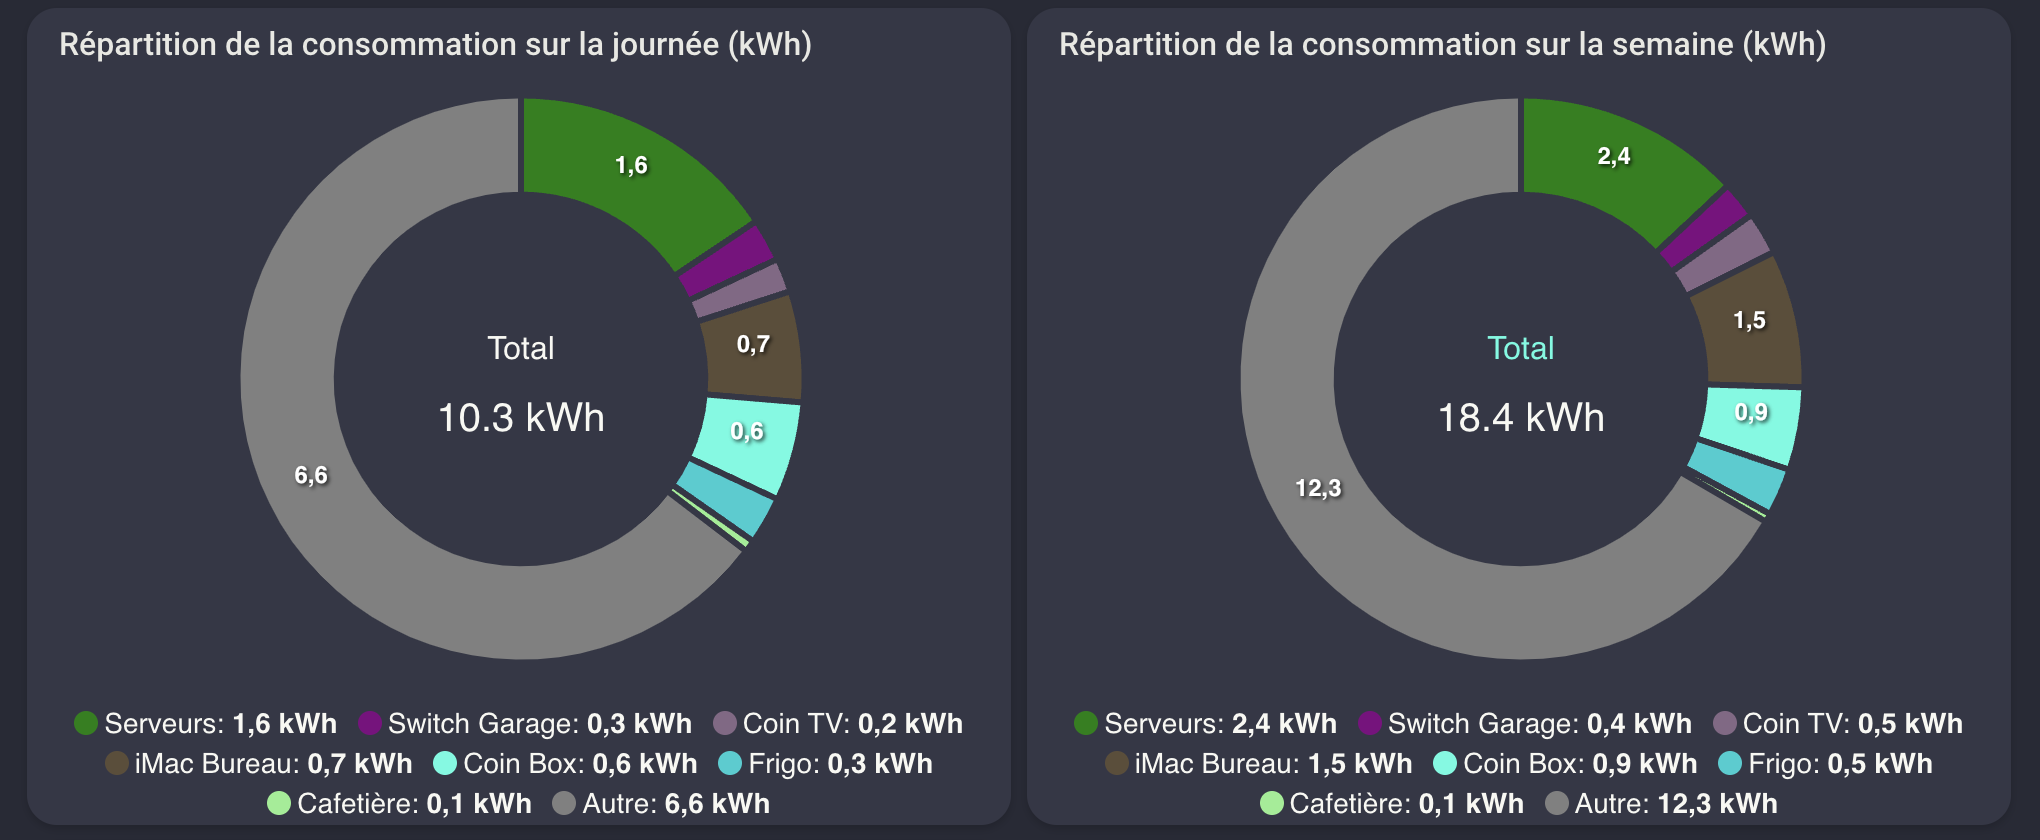
J’ai encore quelques peaufinages à faire niveau couleurs, mais je pense que je vais rester là-dessus, avec en plus les graphes des puissances instantanées (réactives en VA certes… Mais pas loin de la puissance en W).
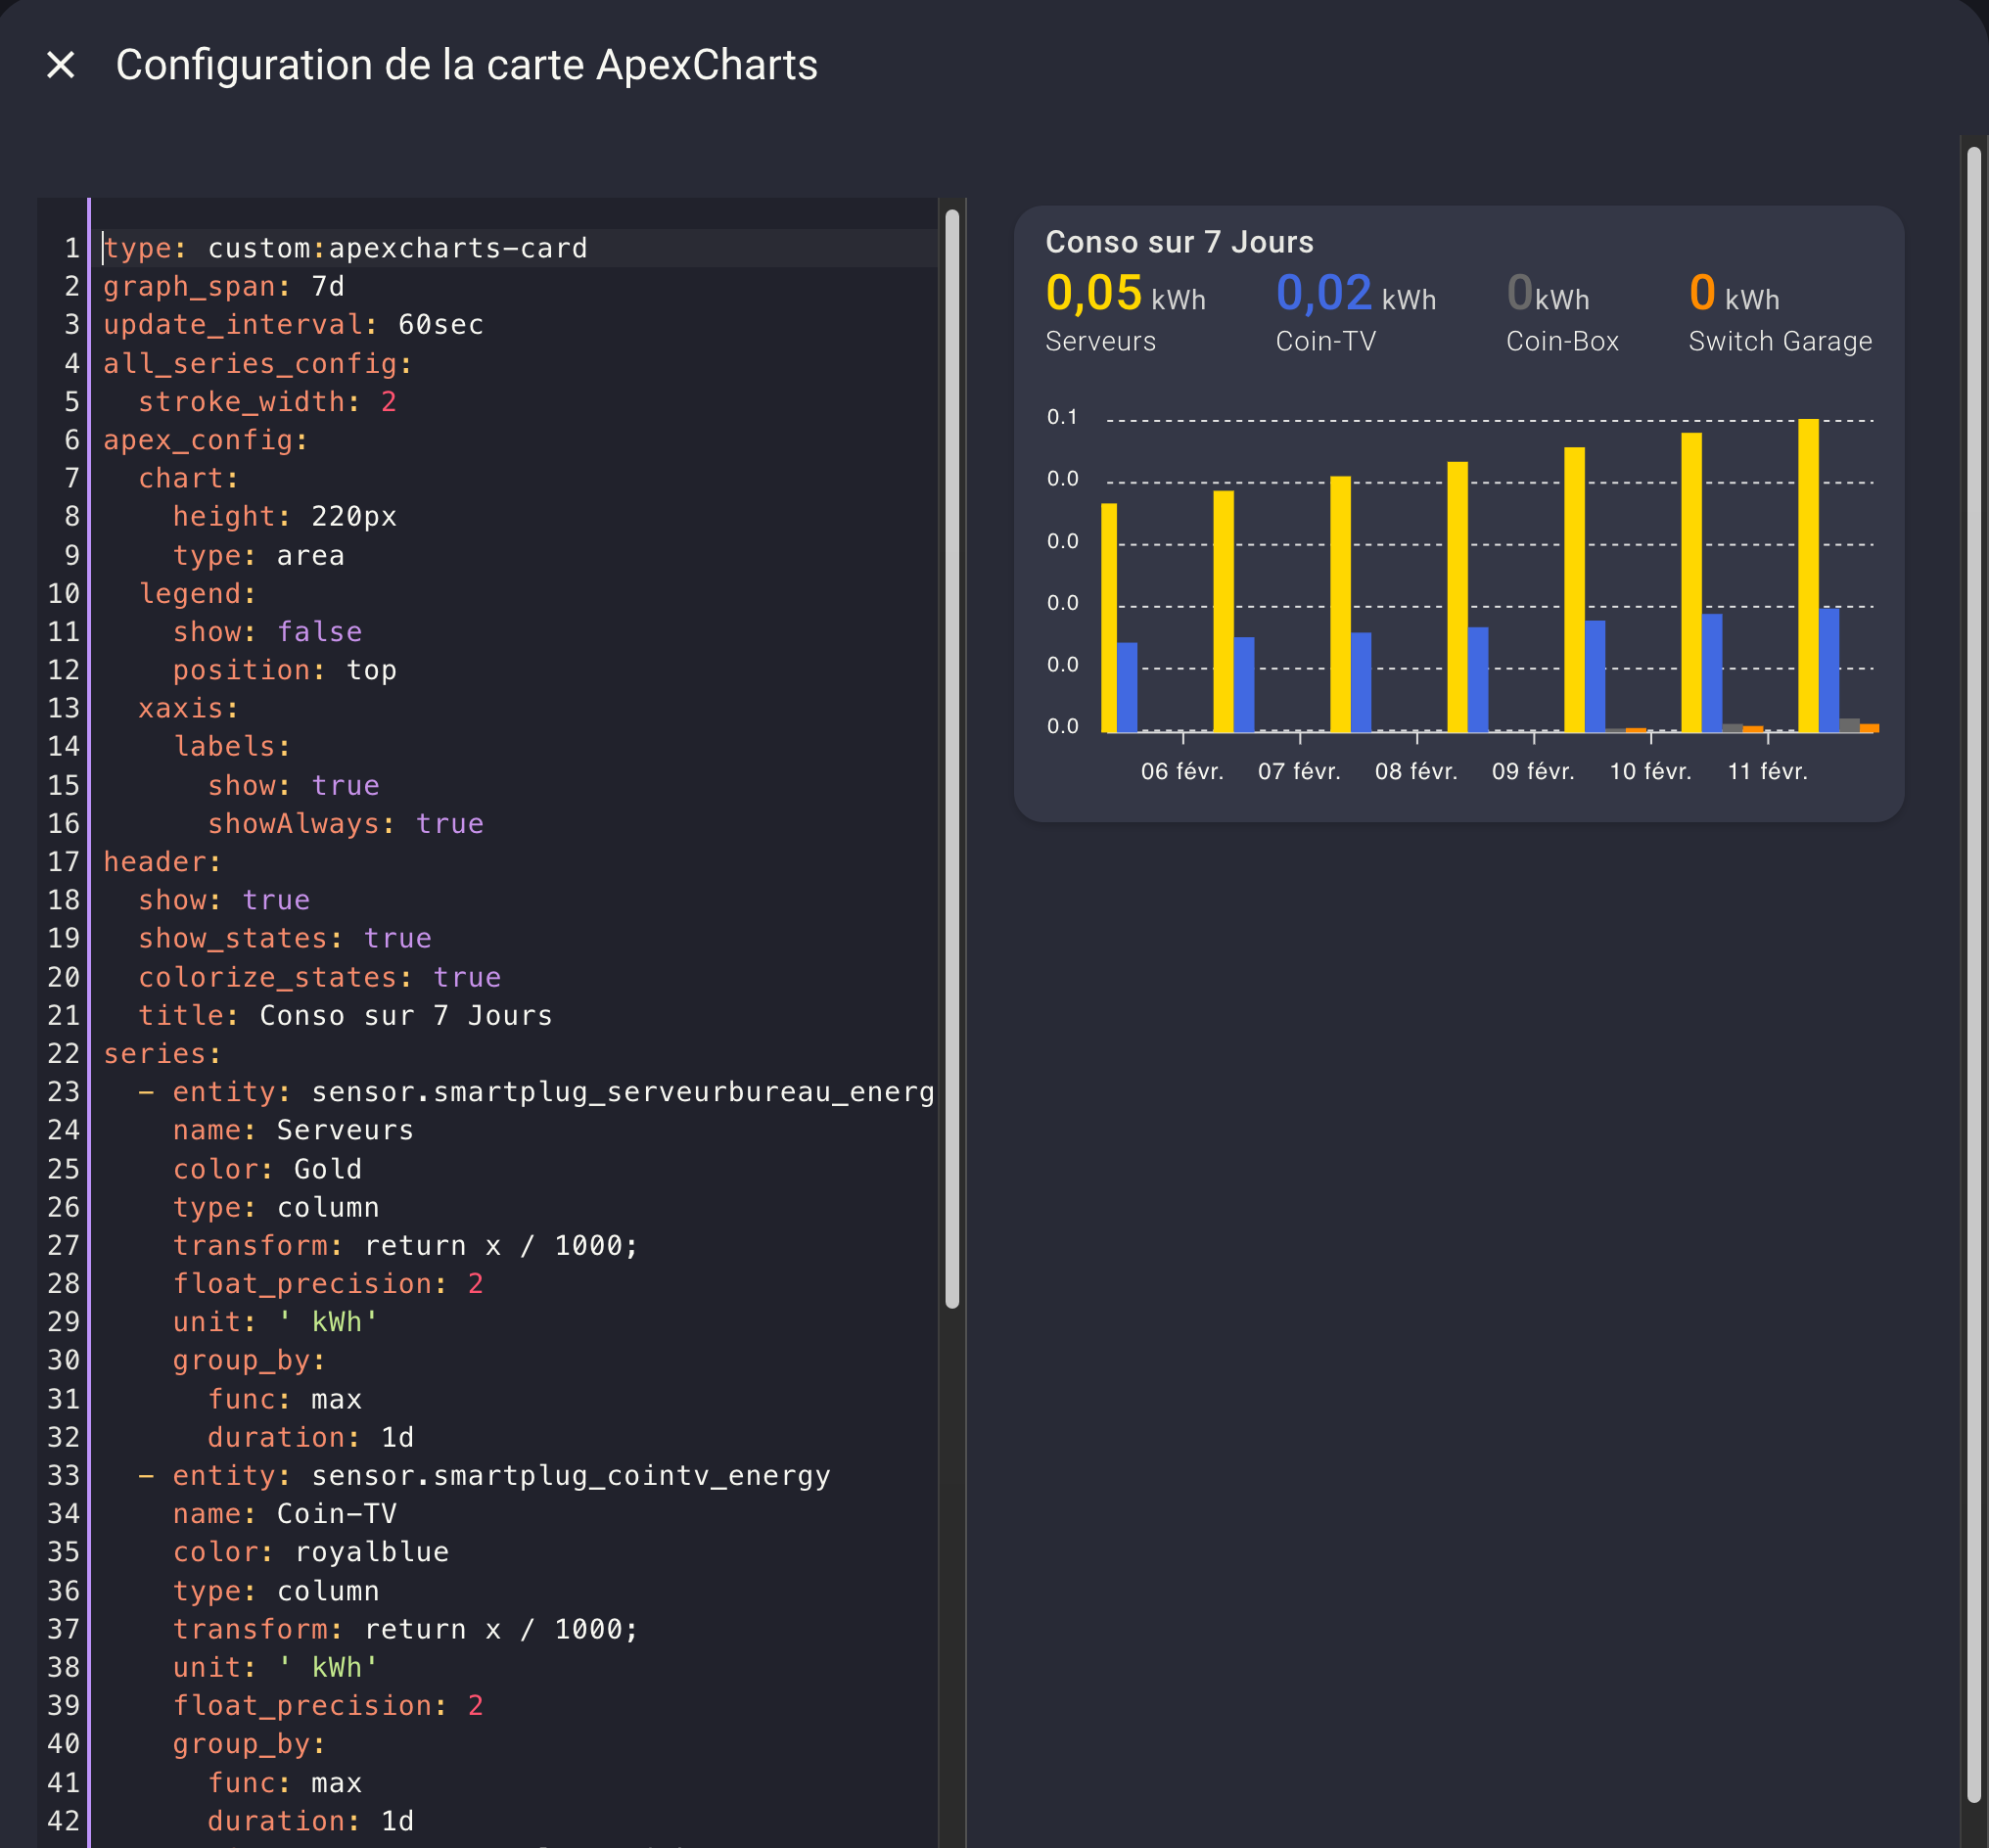
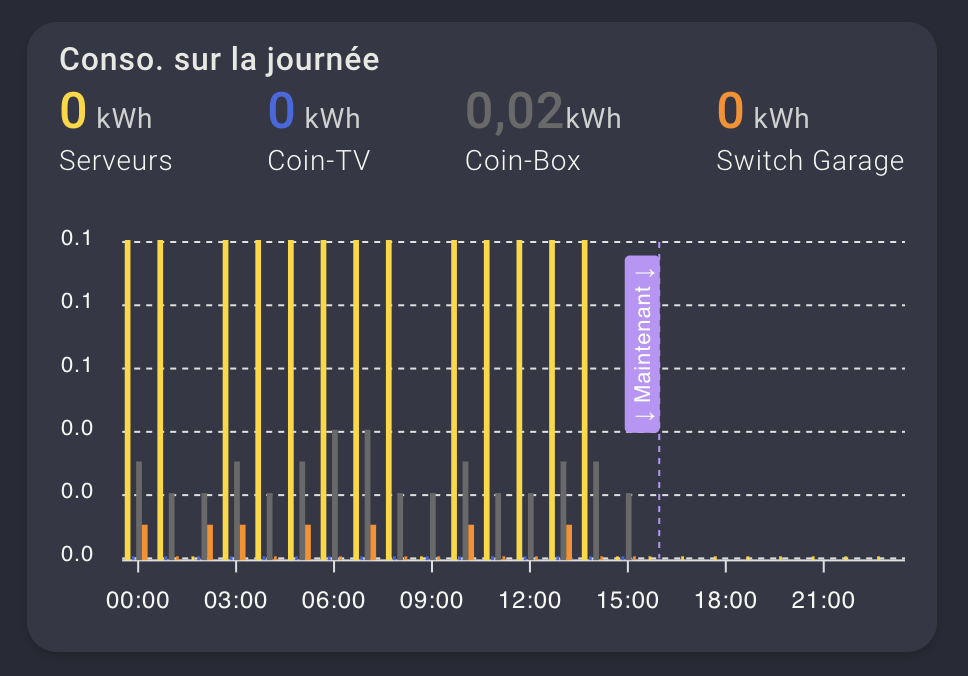
Code de la carte journée
type: custom:apexcharts-card
chart_type: donut
header:
title: Répartition de la consommation sur la journée (kWh)
show: true
show_states: false
colorize_states: true
apex_config:
  plotOptions:
    pie:
      donut:
        labels:
          show: true
          total:
            show: true
            label: Total
            formatter: >
              EVAL:function(w) { return w.globals.seriesTotals.reduce((a, b) =>
              {return (a + b)} , 0).toFixed(1) + " kWh" }
series:
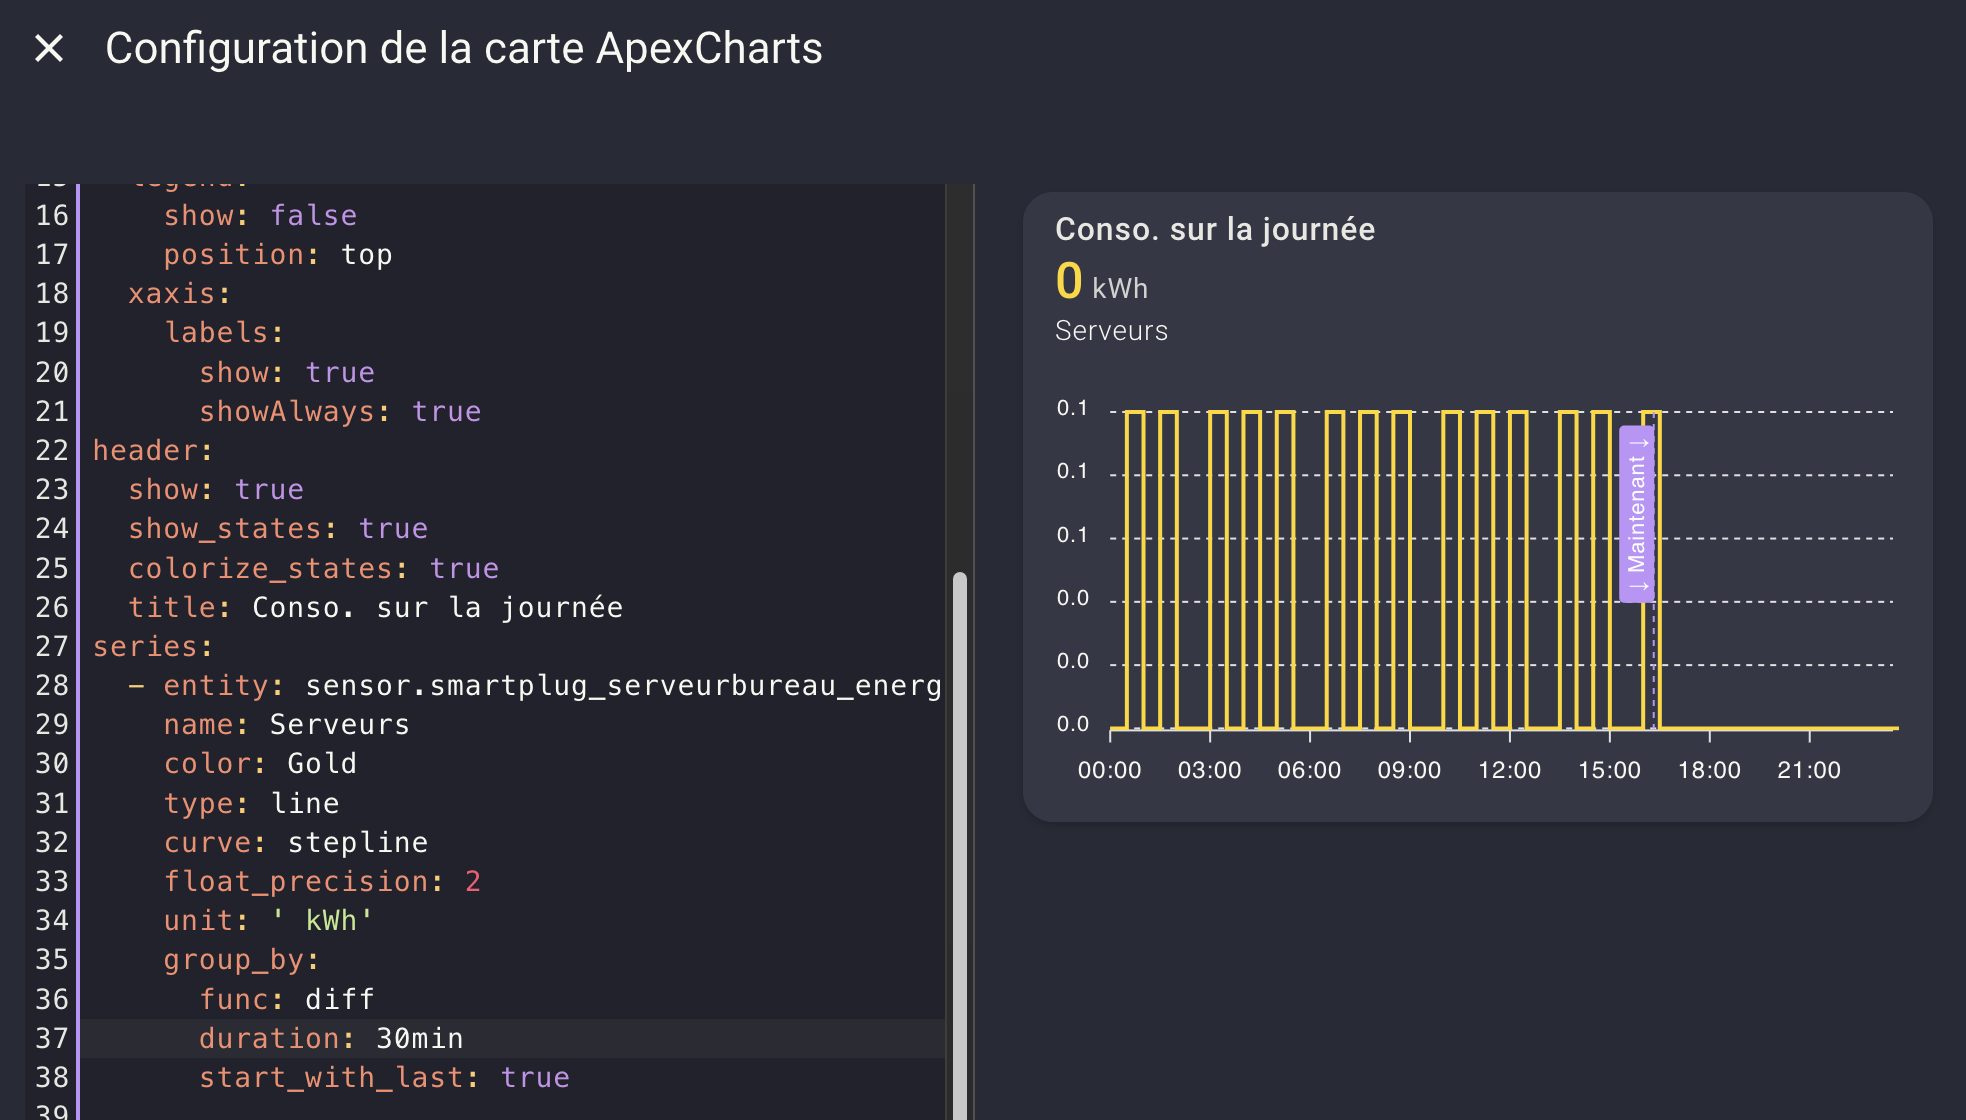
- entity: sensor.serveurs_energy_daily
name: Serveurs
type: column
unit: ' kWh'
color: Green
- entity: sensor.switch_garage_energy_daily
name: Switch Garage
type: column
unit: ' kWh'
color: Purple
- entity: sensor.cointv_energy_daily
name: Coin TV
type: column
unit: ' kWh'
color: rgb(132,104,134)
- entity: sensor.bureau_imac_energy_daily
name: iMac Bureau
type: column
unit: ' kWh'
color: rgb(92,77,56)
- entity: sensor.coin_box_energy_daily
name: Coin Box
type: column
unit: kWh
color: rgb(80,252,226)
- entity: sensor.frigo_energy_daily
name: Frigo
type: column
unit: ' kWh'
color: Darkturquoise
- entity: sensor.cafetiere_energy_daily
name: Cafetière
type: column
unit: ' kWh'
color: Lightgreen
- entity: sensor.zlinky_energy_daily
name: Autre
color: grey
transform: >-
return parseFloat(x) -
parseFloat(hass.states['sensor.serveurs_energy_daily'].state)-
parseFloat(hass.states['sensor.switch_garage_energy_daily'].state)-
parseFloat(hass.states['sensor.cointv_energy_daily'].state)-
parseFloat(hass.states['sensor.bureau_imac_energy_daily'].state)-
parseFloat(hass.states['sensor.coin_box_energy_daily'].state)-
parseFloat(hass.states['sensor.frigo_energy_daily'].state)-
parseFloat(hass.states['sensor.cafetiere_energy_daily'].state)
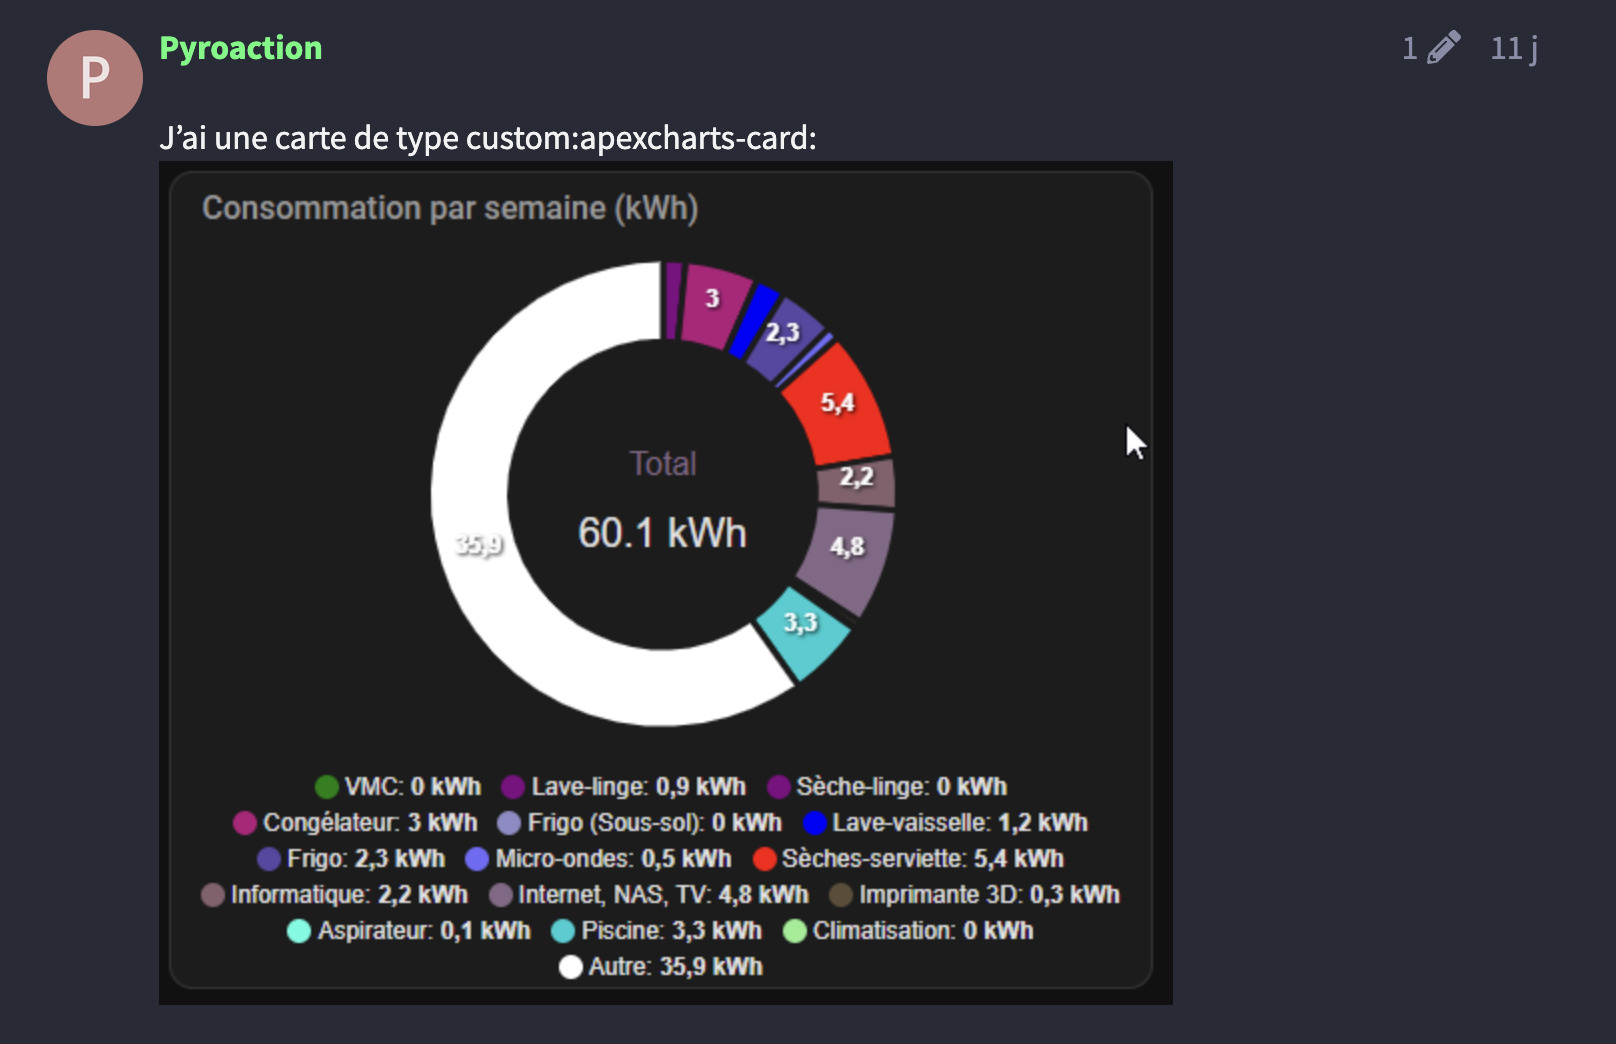
Code de la carte semaine
type: custom:apexcharts-card
chart_type: donut
header:
  title: Répartition de la consommation sur la semaine (kWh)
  show: true
  show_states: false
  colorize_states: true
apex_config:
  plotOptions:
    pie:
      donut:
        labels:
          show: true
          total:
            show: true
            label: Total
            formatter: >
              EVAL:function(w) { return w.globals.seriesTotals.reduce((a, b) =>
              {return (a + b)} , 0).toFixed(1) + " kWh" }
series:
  - entity: sensor.serveurs_energy_weekly
    name: Serveurs
    type: column
    unit: ' kWh'
    color: Green
  - entity: sensor.switch_garage_energy_weekly
    name: Switch Garage
    type: column
    unit: ' kWh'
    color: Purple
  - entity: sensor.cointv_energy_weekly
    name: Coin TV
    type: column
    unit: ' kWh'
    color: rgb(132,104,134)
  - entity: sensor.bureau_imac_energy_weekly
    name: iMac Bureau
    type: column
    unit: ' kWh'
    color: rgb(92,77,56)
  - entity: sensor.coin_box_energy_weekly
    name: Coin Box
    type: column
    unit: kWh
    color: rgb(80,252,226)
  - entity: sensor.frigo_energy_weekly
    name: Frigo
    type: column
    unit: ' kWh'
    color: Darkturquoise
  - entity: sensor.cafetiere_energy_weekly
    name: Cafetière
    type: column
    unit: ' kWh'
    color: Lightgreen
  - entity: sensor.zlinky_energy_weekly
    name: Autre
    color: grey
    transform: >-
      return parseFloat(x) -
      parseFloat(hass.states['sensor.serveurs_energy_weekly'].state)-
      parseFloat(hass.states['sensor.switch_garage_energy_weekly'].state)-
      parseFloat(hass.states['sensor.cointv_energy_weekly'].state)-
      parseFloat(hass.states['sensor.bureau_imac_energy_weekly'].state)-
      parseFloat(hass.states['sensor.coin_box_energy_weekly'].state)-
      parseFloat(hass.states['sensor.frigo_energy_weekly'].state)-
      parseFloat(hass.states['sensor.cafetiere_energy_weekly'].state)
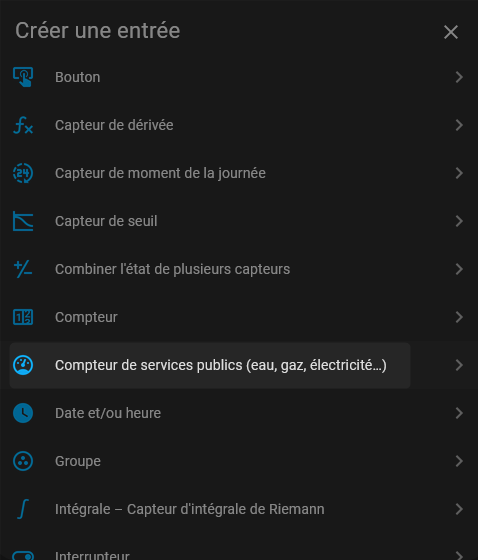
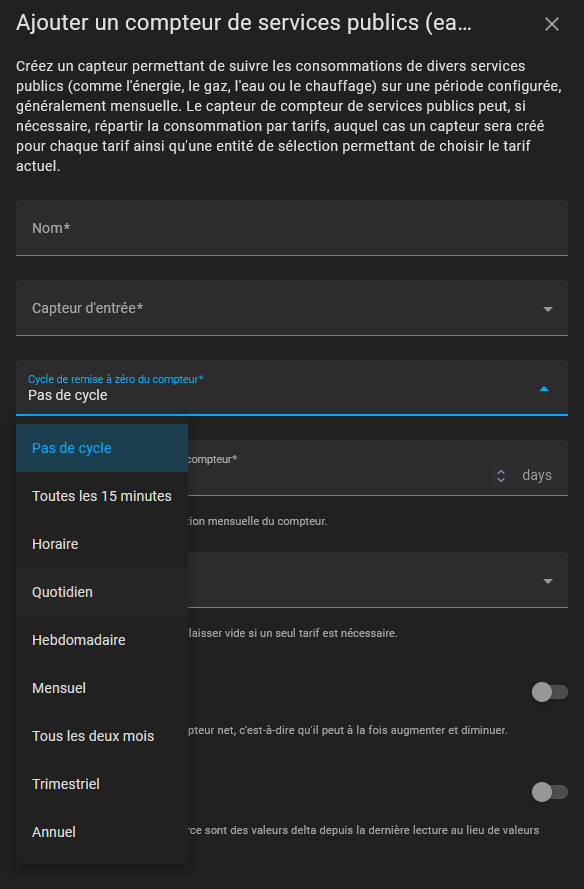
Pour ces cartes j’ai du créer moi aussi des utility_meters :
utility_meters.yaml
# ╔════════════════════════════════════════════════════════════════════════════╗
# ║ Utility Meter : Consommation totale ZLinky                                 ║
# ║   - pendant 1 heure ;                                                      ║
# ║   - pendant 1 jour ;                                                       ║
# ║   - pendant 1 mois ;                                                       ║
# ║   - pendant 1 année.                                                       ║
# ╚════════════════════════════════════════════════════════════════════════════╝
zlinky_energy_hourly:
  source: sensor.zlinky_tic_east
  cycle: hourly
zlinky_energy_daily:
  source: sensor.zlinky_tic_east
  cycle: daily
zlinky_energy_weekly:
  source: sensor.zlinky_tic_east
  cycle: weekly
zlinky_energy_monthly:
  source: sensor.zlinky_tic_east
  cycle: monthly
zlinky_energy_yearly:
  source: sensor.zlinky_tic_east
  cycle: yearly

# Essai avec template totale conso toutes couleurs
zlinky_somme_toutes_couleurs_energy_hourly:
  source: sensor.zlinky_somme_conso_hc_hp_toutes_couleurs
  cycle: hourly

zlinky_somme_toutes_couleurs_energy_daily:
  source: sensor.zlinky_somme_conso_hc_hp_toutes_couleurs
  cycle: daily

  # ╔════════════════════════════════════════════════════════════════════════════╗
  # ║ Utility Meter : Consommation Serveurs                                      ║
  # ║   - pendant 1 heure ;                                                      ║
  # ║   - pendant 1 jour ;                                                       ║
  # ║   - pendant 1 mois ;                                                       ║
  # ║   - pendant 1 année.                                                       ║
  # ╚════════════════════════════════════════════════════════════════════════════╝
serveurs_energy_daily:
  source: sensor.smartplug_serveurbureau_energy
  cycle: daily
serveurs_energy_weekly:
  source: sensor.smartplug_serveurbureau_energy
  cycle: weekly
serveurs_energy_monthly:
  source: sensor.smartplug_serveurbureau_energy
  cycle: monthly
serveurs_energy_yearly:
  source: sensor.smartplug_serveurbureau_energy
  cycle: yearly

  # ╔════════════════════════════════════════════════════════════════════════════╗
  # ║ Utility Meter : Consommation Switch garage                                 ║
  # ║   - pendant 1 heure ;                                                      ║
  # ║   - pendant 1 jour ;                                                       ║
  # ║   - pendant 1 mois ;                                                       ║
  # ║   - pendant 1 année.                                                       ║
  # ╚════════════════════════════════════════════════════════════════════════════╝
switch_garage_energy_daily:
  source: sensor.smartplug_garage_energy
  cycle: daily
switch_garage_energy_weekly:
  source: sensor.smartplug_garage_energy
  cycle: weekly
switch_garage_energy_monthly:
  source: sensor.smartplug_garage_energy
  cycle: monthly
switch_garage_energy_yearly:
  source: sensor.smartplug_garage_energy
  cycle: yearly

  # ╔════════════════════════════════════════════════════════════════════════════╗
  # ║ Utility Meter : Consommation Coint TV                                      ║
  # ║   - pendant 1 heure ;                                                      ║
  # ║   - pendant 1 jour ;                                                       ║
  # ║   - pendant 1 mois ;                                                       ║
  # ║   - pendant 1 année.                                                       ║
  # ╚════════════════════════════════════════════════════════════════════════════╝
cointv_energy_daily:
  source: sensor.smartplug_cointv_energy
  cycle: daily
cointv_energy_weekly:
  source: sensor.smartplug_cointv_energy
  cycle: weekly
cointv_energy_monthly:
  source: sensor.smartplug_cointv_energy
  cycle: monthly
cointv_energy_yearly:
  source: sensor.smartplug_cointv_energy
  cycle: yearly

  # ╔════════════════════════════════════════════════════════════════════════════╗
  # ║ Utility Meter : Consommation Bureau iMac                                   ║
  # ║   - pendant 1 heure ;                                                      ║
  # ║   - pendant 1 jour ;                                                       ║
  # ║   - pendant 1 mois ;                                                       ║
  # ║   - pendant 1 année.                                                       ║
  # ╚════════════════════════════════════════════════════════════════════════════╝
bureau_imac_energy_daily:
  source: sensor.smartplug_bureau_imac_energy
  cycle: daily
bureau_imac_energy_weekly:
  source: sensor.smartplug_bureau_imac_energy
  cycle: weekly
bureau_imac_energy_monthly:
  source: sensor.smartplug_bureau_imac_energy
  cycle: monthly
bureau_imac_energy_yearly:
  source: sensor.smartplug_bureau_imac_energy
  cycle: yearly

  # ╔════════════════════════════════════════════════════════════════════════════╗
  # ║ Utility Meter : Consommation Coin Box.                                     ║
  # ║   - pendant 1 heure ;                                                      ║
  # ║   - pendant 1 jour ;                                                       ║
  # ║   - pendant 1 mois ;                                                       ║
  # ║   - pendant 1 année.                                                       ║
  # ╚════════════════════════════════════════════════════════════════════════════╝
coin_box_energy_daily:
  source: sensor.smartplug_coinbox_energy
  cycle: daily
coin_box_energy_weekly:
  source: sensor.smartplug_coinbox_energy
  cycle: weekly
coin_box_energy_monthly:
  source: sensor.smartplug_coinbox_energy
  cycle: monthly
coin_box_energy_yearly:
  source: sensor.smartplug_coinbox_energy
  cycle: yearly

  # ╔════════════════════════════════════════════════════════════════════════════╗
  # ║ Utility Meter : Consommation Frigo.                                        ║
  # ║   - pendant 1 heure ;                                                      ║
  # ║   - pendant 1 jour ;                                                       ║
  # ║   - pendant 1 mois ;                                                       ║
  # ║   - pendant 1 année.                                                       ║
  # ╚════════════════════════════════════════════════════════════════════════════╝
frigo_energy_daily:
  source: sensor.smartplug_frigo_energy
  cycle: daily
frigo_energy_weekly:
  source: sensor.smartplug_frigo_energy
  cycle: weekly
frigo_energy_monthly:
  source: sensor.smartplug_frigo_energy
  cycle: monthly
frigo_energy_yearly:
  source: sensor.smartplug_frigo_energy
  cycle: yearly

  # ╔════════════════════════════════════════════════════════════════════════════╗
  # ║ Utility Meter : Consommation Cafetière.                                    ║
  # ║   - pendant 1 heure ;                                                      ║
  # ║   - pendant 1 jour ;                                                       ║
  # ║   - pendant 1 mois ;                                                       ║
  # ║   - pendant 1 année.                                                       ║
  # ╚════════════════════════════════════════════════════════════════════════════╝
cafetiere_energy_daily:
  source: sensor.smartplug_cafetiere_energy
  cycle: daily
cafetiere_energy_weekly:
  source: sensor.smartplug_cafetiere_energy
  cycle: weekly
cafetiere_energy_monthly:
  source: sensor.smartplug_cafetiere_energy
  cycle: monthly
cafetiere_energy_yearly:
  source: sensor.smartplug_cafetiere_energy
  cycle: yearly
Et j’ai aussi voulu voir si mon sensor.zlinky_tic_east qui est censé être la consommation cumulée fournie par le ZLinky_TIC était la même que l’ajout de toutes les consommations des HC/HP des différentes couleurs pour la journée en question, ou l’heure.
Code du template somme
# ╔══════════════════════════════════════════════════════════════════════════╗
# ║ Configuration pour la somme des consommations toutes couleurs TEMPO      ║
# ╚══════════════════════════════════════════════════════════════════════════╝

# Partie pour la dérivée des consommations HC/HP des différentes couleurs de jours
# Voir ce post : https://forum.hacf.fr/t/cle-zlinky-lixee-avec-zha-conbee2-remonter-dans-energie-hp-hc/9058/173

- sensor:
  - name: "ZLinky Somme Conso. HC_HP toutes couleurs"
    unique_id: "zlinky_somme_conso_HC_HP_toutes_couleurs"
    unit_of_measurement: "Wh"
    device_class: energy
    state_class: total_increasing
    state: >-
        {% set HCbleu = states('sensor.zlinky_tic_easf01')|float(default=0)*1000 %}
        {% set HPbleu = states('sensor.zlinky_tic_easf02')|float(default=0)*1000 %}
        {% set HCblanc = states('sensor.zlinky_tic_easf03')|float(default=0)*1000 %}
        {% set HPblanc = states('sensor.zlinky_tic_easf04')|float(default=0)*1000 %}
        {% set HCrouge = states('sensor.zlinky_tic_easf05')|float(default=0)*1000 %}
        {% set HProuge = states('sensorz.zlinky_tic_easf06')|float(default=0)*1000 %}
        {{ HCbleu + HPbleu + HCblanc + HPblanc +  HCrouge + HProuge | int(default=0) }}
    availability: "{{ states('sensor.zlinky_tic_easf01')|is_number and states('sensor.zlinky_tic_easf02')|is_number and states('sensor.zlinky_tic_easf03')|is_number and states('sensor.zlinky_tic_easf04')|is_number and states('sensor.zlinky_tic_easf05')|is_number and states('sensor.zlinky_tic_easf06')|is_number }}"
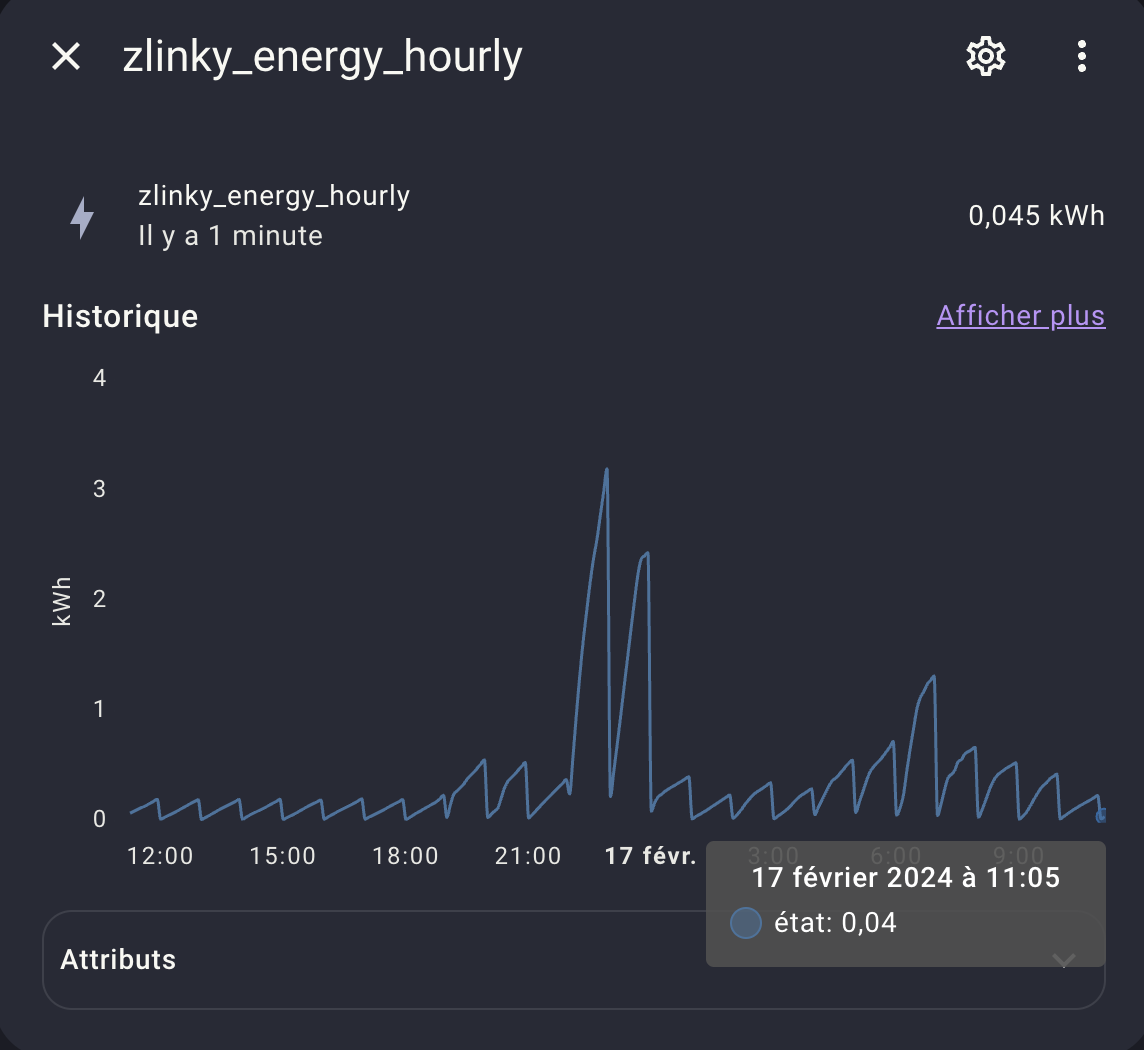
Et il y un pas grand-chose de décalage entre les deux sur une heure, ou sur une journée
Sur 1h, j’ai 2Wh de différence :
Sur la journée, j’ai 4 Wh de différence :
Quelqu’un a-t-il une idée d’où peut venir cette différence ?
(je vais faire un autre sujet sur comment avoir un beau switch pour une prise connectée qui permette d’allumer ce qui est dessus ou de tout couper, car j’ai un truc qui ne le plait pas trop…)